Spend in cultural shops and cafés
September 2022
This research is from The Audience Agency's nationwide longitudinal (ongoing) panel survey of changing views about participating in creative and cultural activities through the recent and ongoing crises, and beyond, the Cultural Participation Monitor.
Contents
Themes
As audiences tighten their belts, they also plan to reduce their general spend in venues' shops and cafés, though the former looks to be harder hit than the latter, where younger and highly culturally engaged visitors express a willingness to pay slightly more for greener and more ethical alternatives.
Feelings of being worse off and likely to spend less translate into less inclination to visit arts venues' gift shops and, to a lesser extent, cafés across all types of activity.

- 26-35% say they are less likely to go to a gift shop for the different artforms than before the pandemic, while only 8-9% said they were more likely.
- Intentions to visit venues' cafés are similar but less marked, with 21-26% less likely and 13-18% more likely to do so.
- Shop footfall is therefore likely to fall further than café footfall.
Spending Habits in Gift Shops
People mainly buy for:
- themselves (53%),
- followed by children they're with (28%),
- then adults they aren't (15%).

Though these habits break down more specifically by the age of the spender:
- the older the respondent, the less likely they are to be buying for themselves;
- middle-aged groups are more likely than others to be buying for children they are with;
- older respondents are more likely to be buying for children (and adults) they aren’t with.
Spending Habits in Cafés


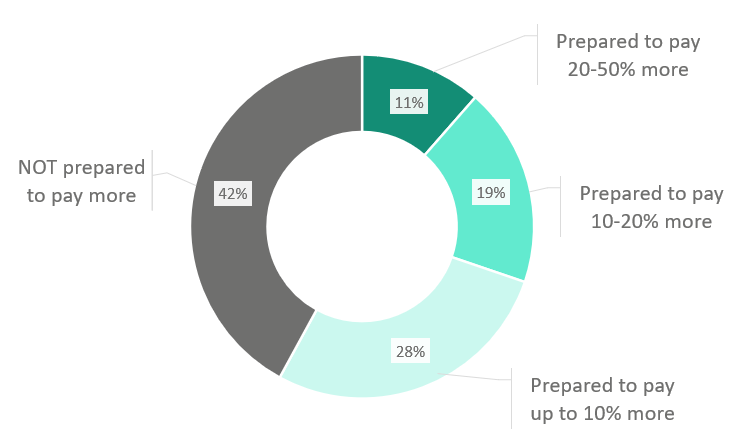
At 58%, most say they are prepared to pay more for green alternatives, but few more than 20% more (28% up to 10% more; 19% 10-20% more; 11% 20-50% more).
- Almost 4 in 10 of those who wouldn't pay more would still prefer green alternatives, if at the same price.
- This suggests that there is scope for greener offers, but that price sensitivity remains important.
- Willingness to pay more for green alternatives was higher among younger groups (22% of 16-24s, but only 2% of those 75+), and for those in the lowest quartile by IMD (16%, cf. 9% in the highest quartile).
Related videos
Other findings from Wave 7 | Sep 2022 | Cost of Living, everyday participation, shops/cafés
-
Cost of living crisis
The vast majority of respondents say that they are worried about the effects of the cost-of-living crisis on them and their household, with a whopping 92% intending to scale back on entertainment spend outside of the home as a result, especially among mid-engaged, middle-aged and less urban groups.
-
Everyday creative participation
While financial uncertainty might make people nervous about splashing out on more expensive arts and culture activities, over 40% of people say that pursuing creative hobbies in their own time is a key interest, a trend that skews towards younger participants and has increased through the pandemic.
-
Ongoing Attitudes to Covid
Fears surrounding Covid-19 are softening, with half feeling 'back to normal' and fewer than 1 in 10 people expressing strong concern about catching the virus themselves, although over half still worry about vulnerable friends and family, while support for certain safety precautions remains high.
