Flatliners
October 2024
This research is from The Audience Agency's nationwide longitudinal (ongoing) panel survey of changing views about participating in creative and cultural activities through the recent and ongoing crises, and beyond, the Cultural Participation Monitor.
Themes
Are audience numbers finally on the move…?
This article is the first in a mini-series, focused on 1) current attitudes and engagement levels, 2) the drivers and inhibitors of engagement for different groups and 3) opportunities to increase engagement.
Six months have passed since the last wave of the Cultural Participation Monitor. That wave, in March 2024, was in the final days of the Sunak government. Interest rates were at their highest for 16 years. Inflation was still higher than it’d been at any point in the decade before the escalation of the Ukraine war. The public was feeling the pinch after another long winter of higher fuel prices. As a result, audience numbers had seemingly hit a ceiling: levelling off below pre-pandemic levels, offering no relief from the raised costs for cultural organisations.
Half a year later, plenty has changed: a new government, decreases in inflation and interest rates, and the UK leg of Taylor Swift’s Eras Tour coming then going, giving way to an Oasis reunion. The resulting consternation over dynamic pricing did at least show that some people had substantial amounts of money available to spend on tickets, even if they resented the pricing mechanism… So, with all this flux, how have audiences responded overall? Are audience numbers finally on the move…?
It's a mixed picture, but broadly: no. If you ask people how they feel (whether they are worse off, for example, or whether they are worried about the cost of living, or whether they will attend less as a result) the metrics are strikingly similar to six months ago (30% vs 33%, 72% agree vs 71%, 63% agree vs 61%, respectively). Likewise, if you ask whether people are attending more or less than before, the proportions are 13% and 23%, compared to 12% and 23% six months earlier.
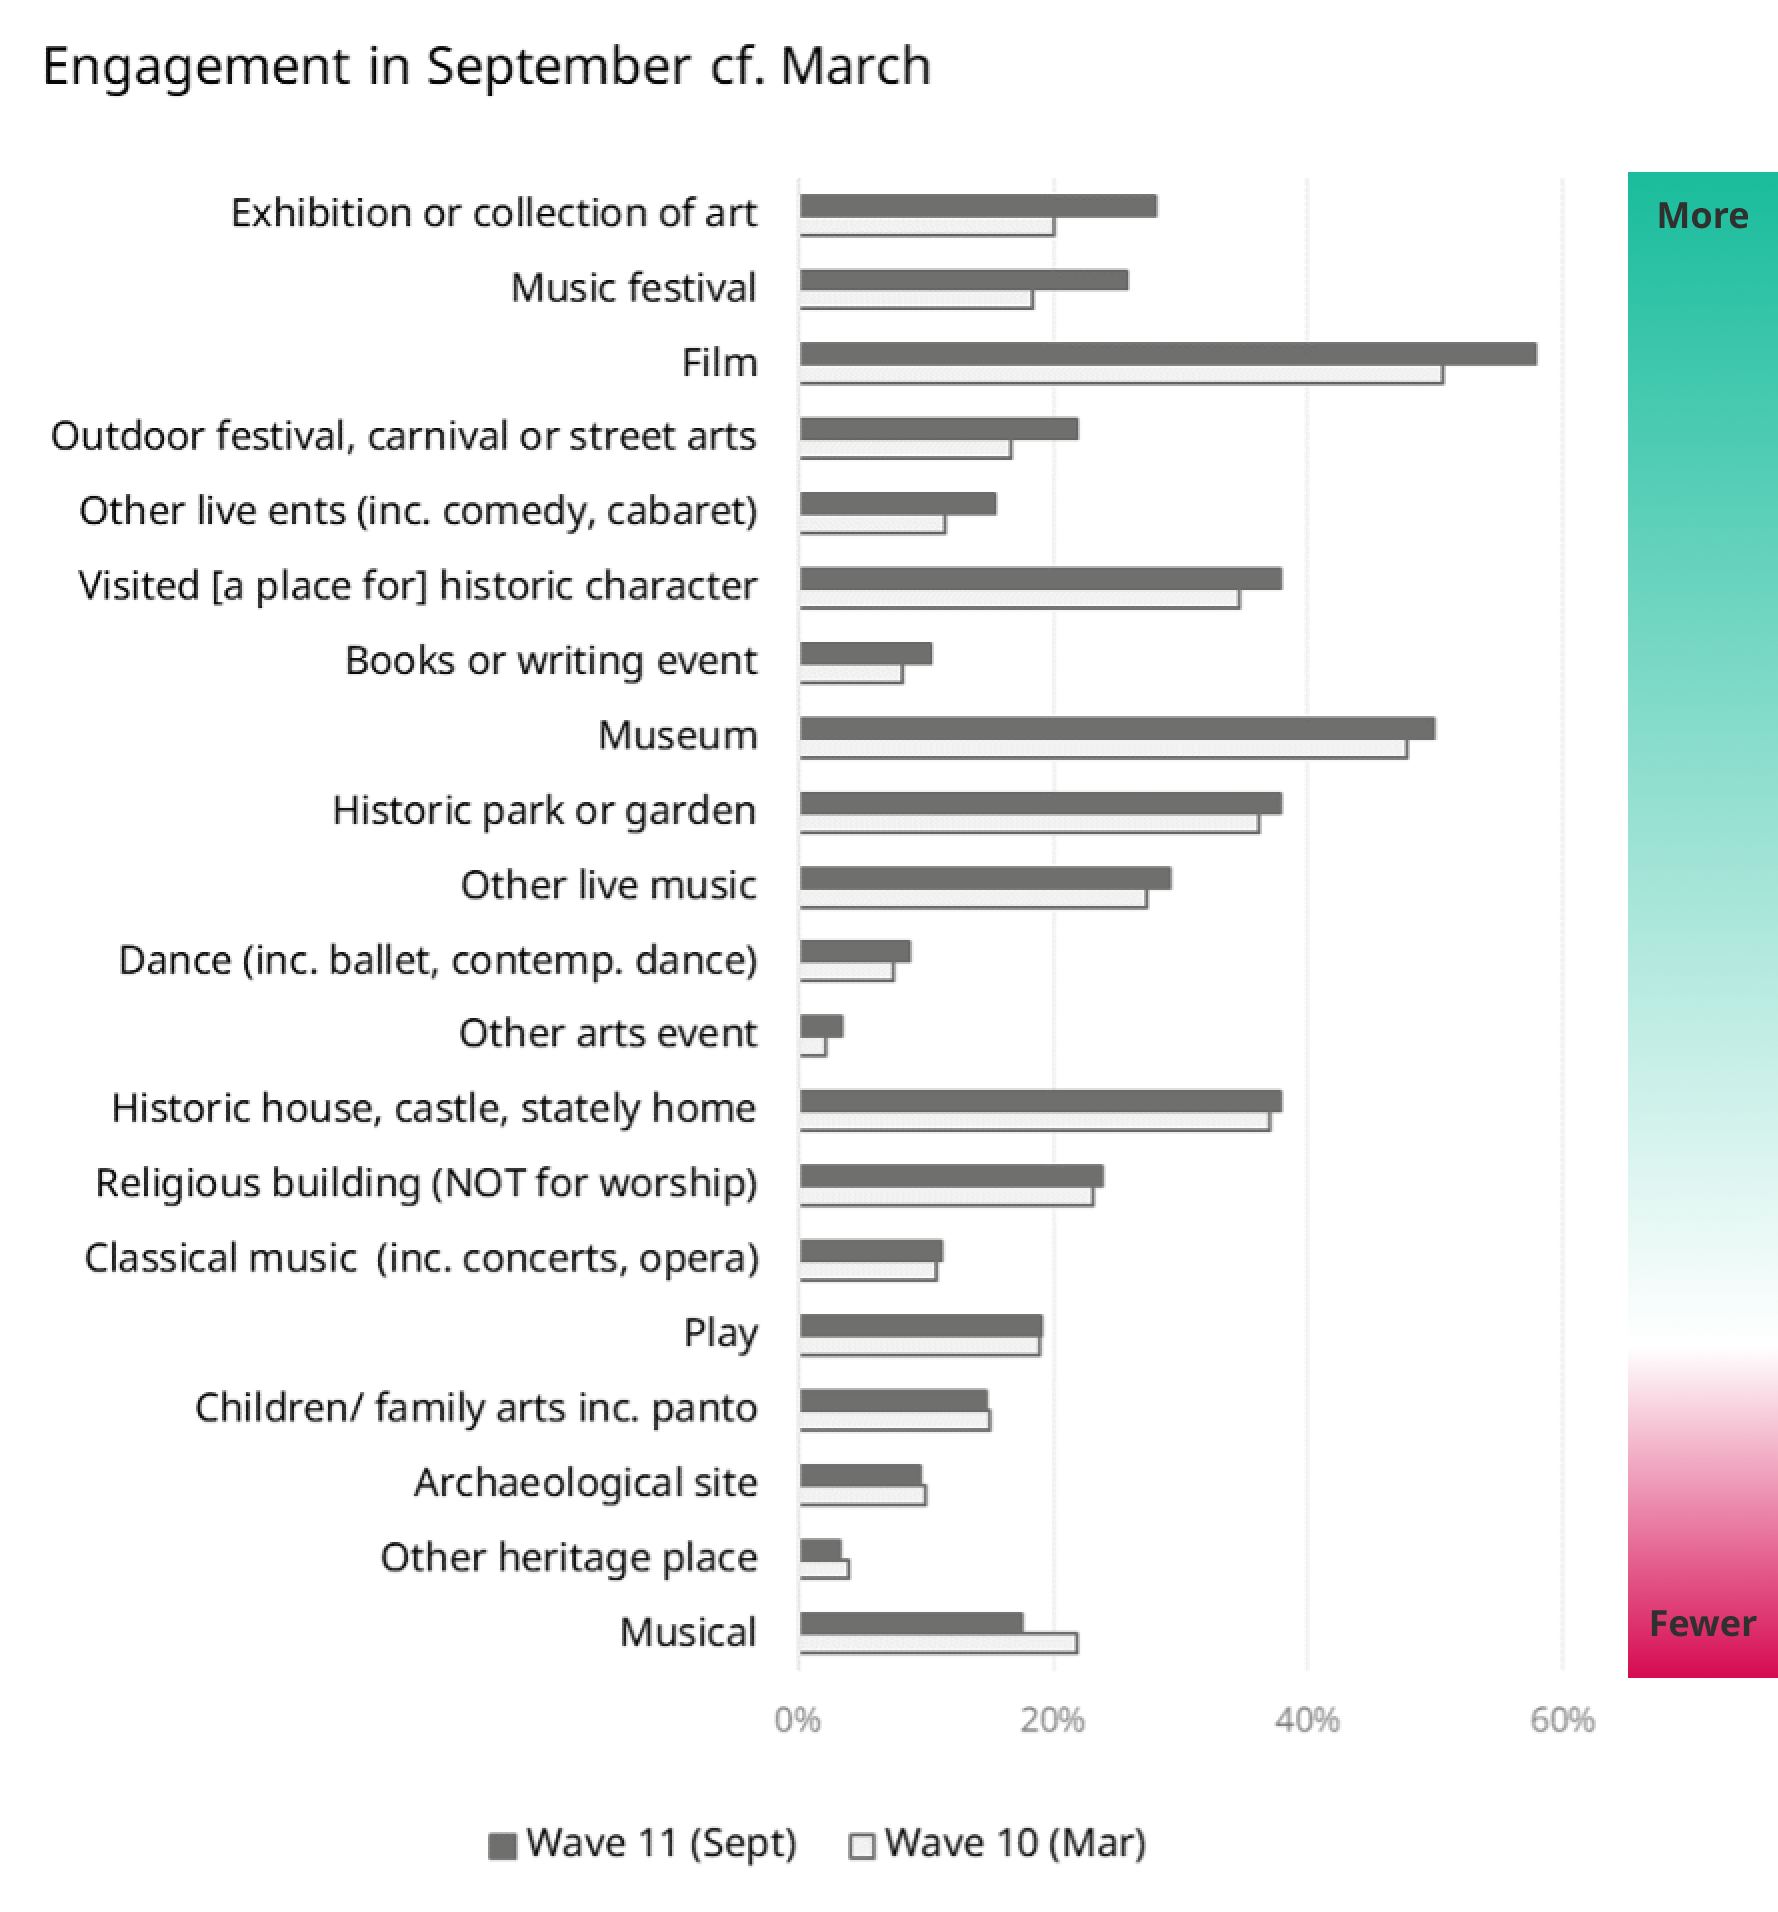
Where we do see an increase is the proportions who say that they have done some cultural activities in the last 12 months. The figures are higher for several activities, notably those which are free, lower cost or which tend to have younger audiences, such as visual arts, music festivals and film. Conversely, they are similar to previous levels for the types of heritage venues which tend to have an older audience and for many performing arts (and are even lower than before for musicals, which tend to have higher ticket prices). This reflects the shift in audience profile we have seen (summarised here)

However, the Department for Digital, Culture, Media and Sport’s Participation Survey shows ‘no change’ between this summer and a year before, across a wide range of activities, including many of those listed here (such as art exhibitions and film). This is from a slightly earlier period than the latest Cultural Participation Monitor (April to June, rather than September), with a comparator a year rather than six months back, so there are some differences. But it has a large sample and robust methodology, and it doesn’t suggest that big changes were underway in the period it covers.
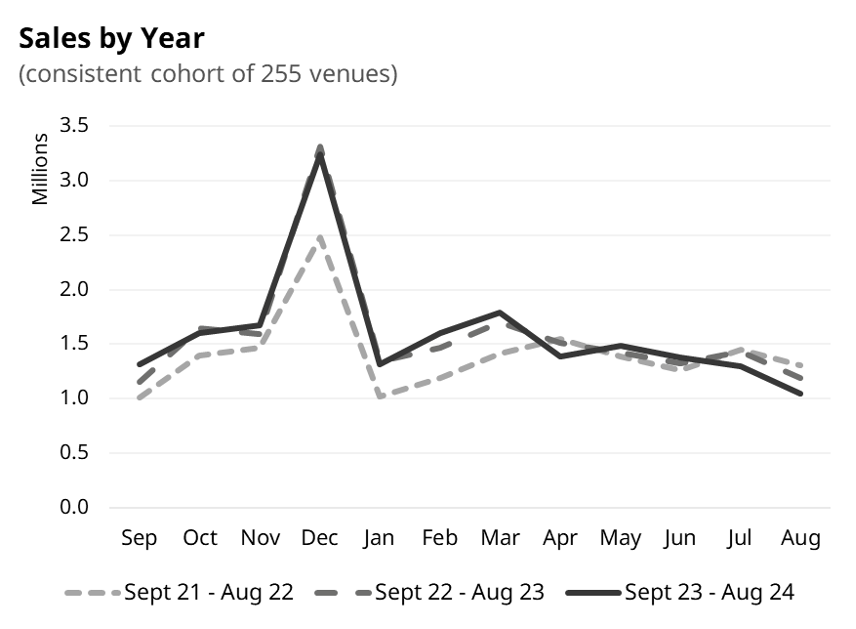
Figures from Audience Answers (our audience data aggregation service) provide a further clue to what’s going on. By looking at a consistent cohort of 255 venues, we can see how sales have changed over the past three years:

After an increase from the 2021/22 to 2022/23 theatre years (September to August), which was mainly concentrated in the September to March period, sales remained consistent the following year, even falling away slightly over the summer. This suggests that total sales were not increasing, at least for the performing arts which comprise most of the Audience Answers ticketing dataset. Also, notably, the sales figures are, if anything, lower in the period after the DCMS Participation Survey, rather than notably increased.
In summary, then, it seems safest to conclude that overall engagement has been flat over the past six months, with flat underlying financial drivers (people feeling worse off and worried about the cost of living), being reflected in the flat engagement levels seen in many sources. Where we do see a difference in the Cultural Participation Monitor, it may reflect seasonal spikes not picked up in the sales data (e.g. recent large-scale tours and summer music festivals picking up on previous years, as well as healthy summer film sales). This would also fit with the groups we know are attending more than previously.
Where we see a much stronger difference is in the changes to people’s circumstances over a longer time period, which also shows striking differences in these changes between groups. Those background drivers of engagement will be the topic of the second article in this mini-series.
Related videos
Cultural Participation Monitor | Latest Findings on Audience Attitude and Behaviours
Watch nowTEA Break: Bad behaviour? - What types of behaviour people prefer when attending culture
Watch nowTEA Break | From Interest into Action
Watch nowTEA Break | More Insights on Changing Audiences
Watch nowTEA Break | Key Changing Audiences for Art Forms
Watch nowOther findings from Wave 11 | Sep 2024 | Gifts of memberships/vouchers, print/digital, museums
-
The market for gifts of vouchers and memberships
We’ve seen that gifts of vouchers to visitor attractions and memberships for heritage organisations, are seen as ‘good presents’, and that vouchers for a range of culture and leisure organisations have become more popular in recent years. But who is the market for them?
-
Are vouchers and memberships good presents?
In this article we explore how likely people are to appreciate vouchers and memberships as presents, and which groups to target with them.
