Sales changes: the biggest movers
August 2024
Contents
Themes
Despite an overall decline in ticket sales, segments like Frontline Families and Trips & Treats have surged, while Home & Heritage and Commuterland Culturebuffs have seen significant drops, underscoring the importance of understanding audience subsegments to navigate these shifts effectively.
Overall Sales Level
We saw in a previous article that overall sales in 2023/24 were down 10% on 2018/19 (for a consistent set of 250 venues) and that there was considerable difference between the changes for different audience types, using Audience Spectrum. In this article, we’ll look in more detail at the segments which have changed most, including exploring how they’ve changed when using the subsegments of Audience Spectrum. For some Audience Spectrum types, both subsegments have changed the same way (and amount), for others, there is a stark difference. This highlights cases where it’s important to understand your own audience and local area at this greater level of detail, to understand what is really going on.
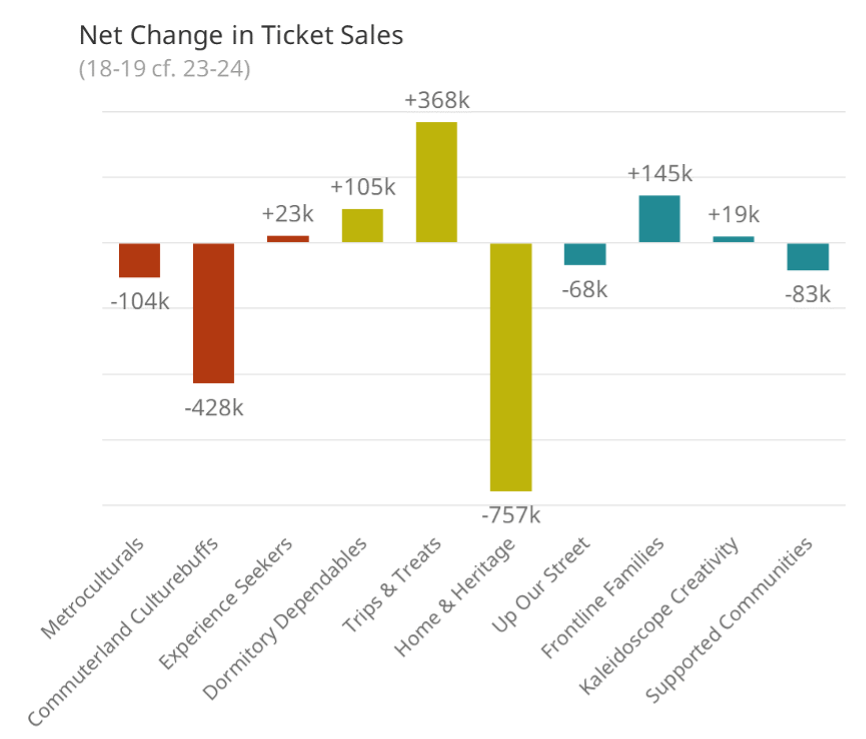
In that previous article, we looked at the proportional change for each segment (comparing to 2018/19 as a baseline year). But of course, for ticket sales, we’re also interested in the absolute volumes. A small decrease of a big segment is more significant than a slightly bigger decrease of a small one. For this, it helps to look at the change in numbers of tickets by Audience Spectrum type:

This makes clear the four segments that account for most of the changes: Home & Heritage and Commuterland Culturebuffs (for the decreases) and Trips & Treats and Frontline Families for the increases. The following chart highlights those four segments (with bold, coloured labels) whilst showing them in the context of the degree of change (horizontal axis) and the proportion of the 2018/19 audience (vertical axis), with the bubbles scaled to the 2023/24 audience segment size:
This shows that the segments that most notably decreased were segments that were a higher proportion of the previous audience than those that most notably increased (as well as indicating that Dormitory Dependables is another segment that could be useful to explore, now being very nearly the same size as Commuterland Culturebuffs).
The Main Increases
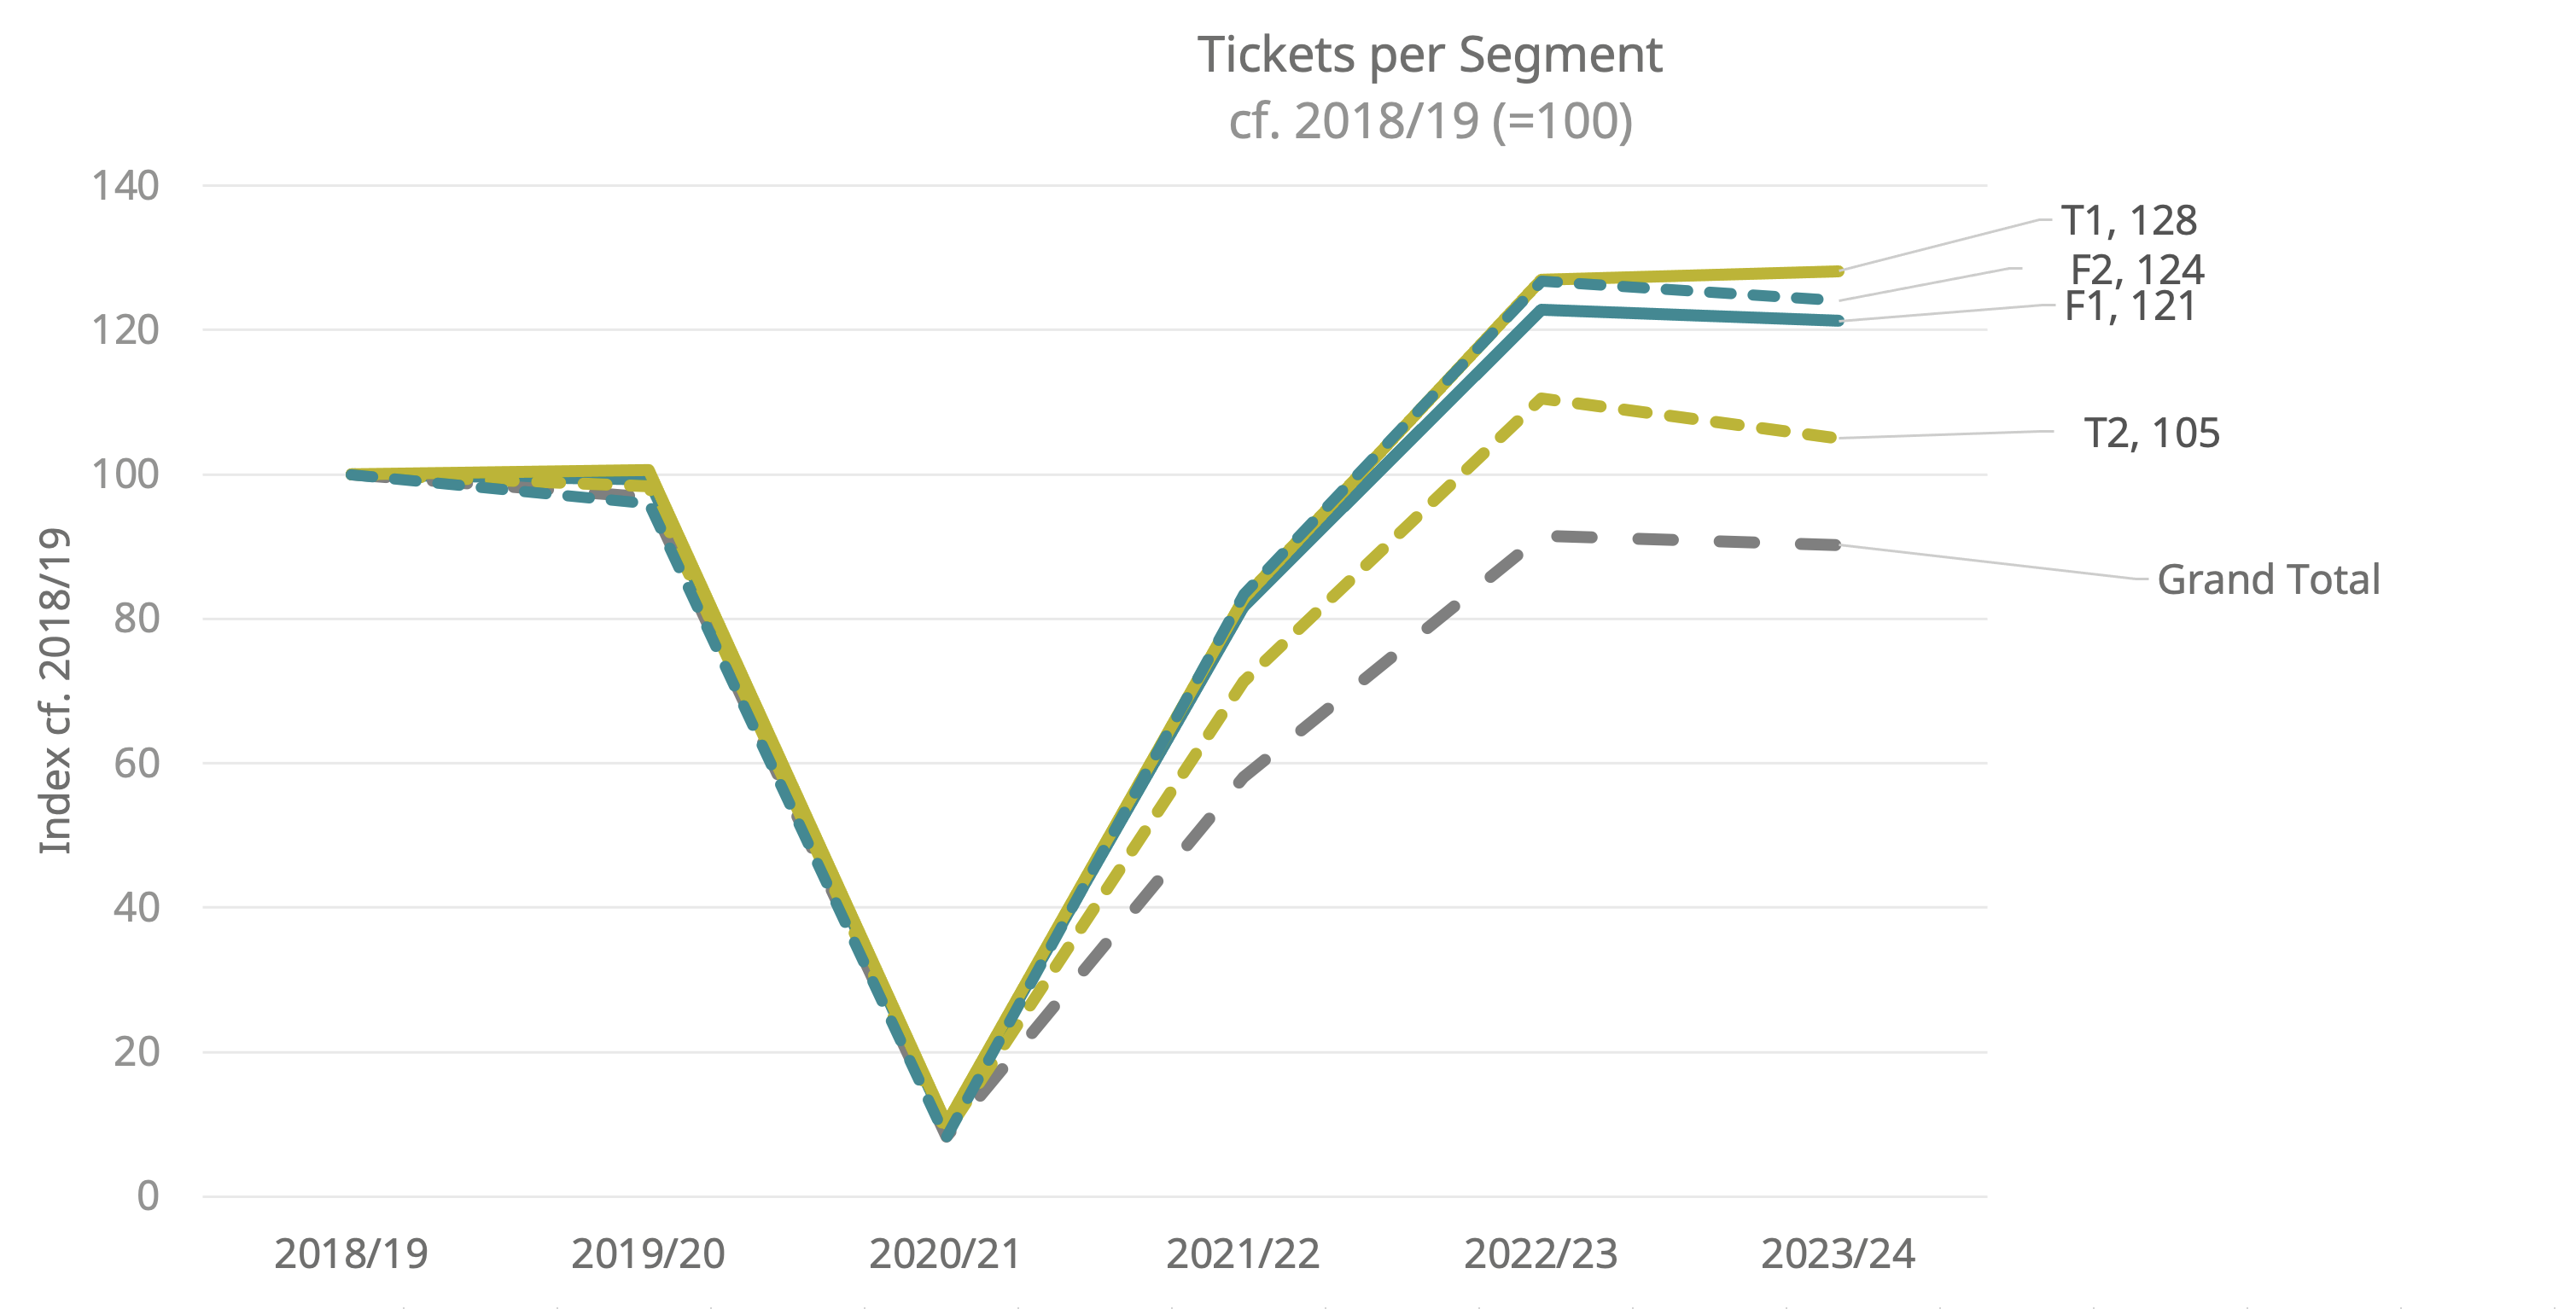
The two segments that increased most were Frontline Families (+25%) and Trips & Treats (+20%). What is notable, however, is that both Frontline Families subsegments increased by similar amounts (F1 — ‘Older families getting by despite challenges’ and F2 — Younger, cash-strapped families starting out’), whereas Trips & Treats had one segment that increased more than any other (T1 — ‘Modern young families building a future’) and one which hardly increased at all (T2 — ‘Settled families with established lifestyles’). This latter group is closer in profile to Dormitory Dependables D1 (and increased a similarly modest amount) than the younger T1 group.

The Main Decreases
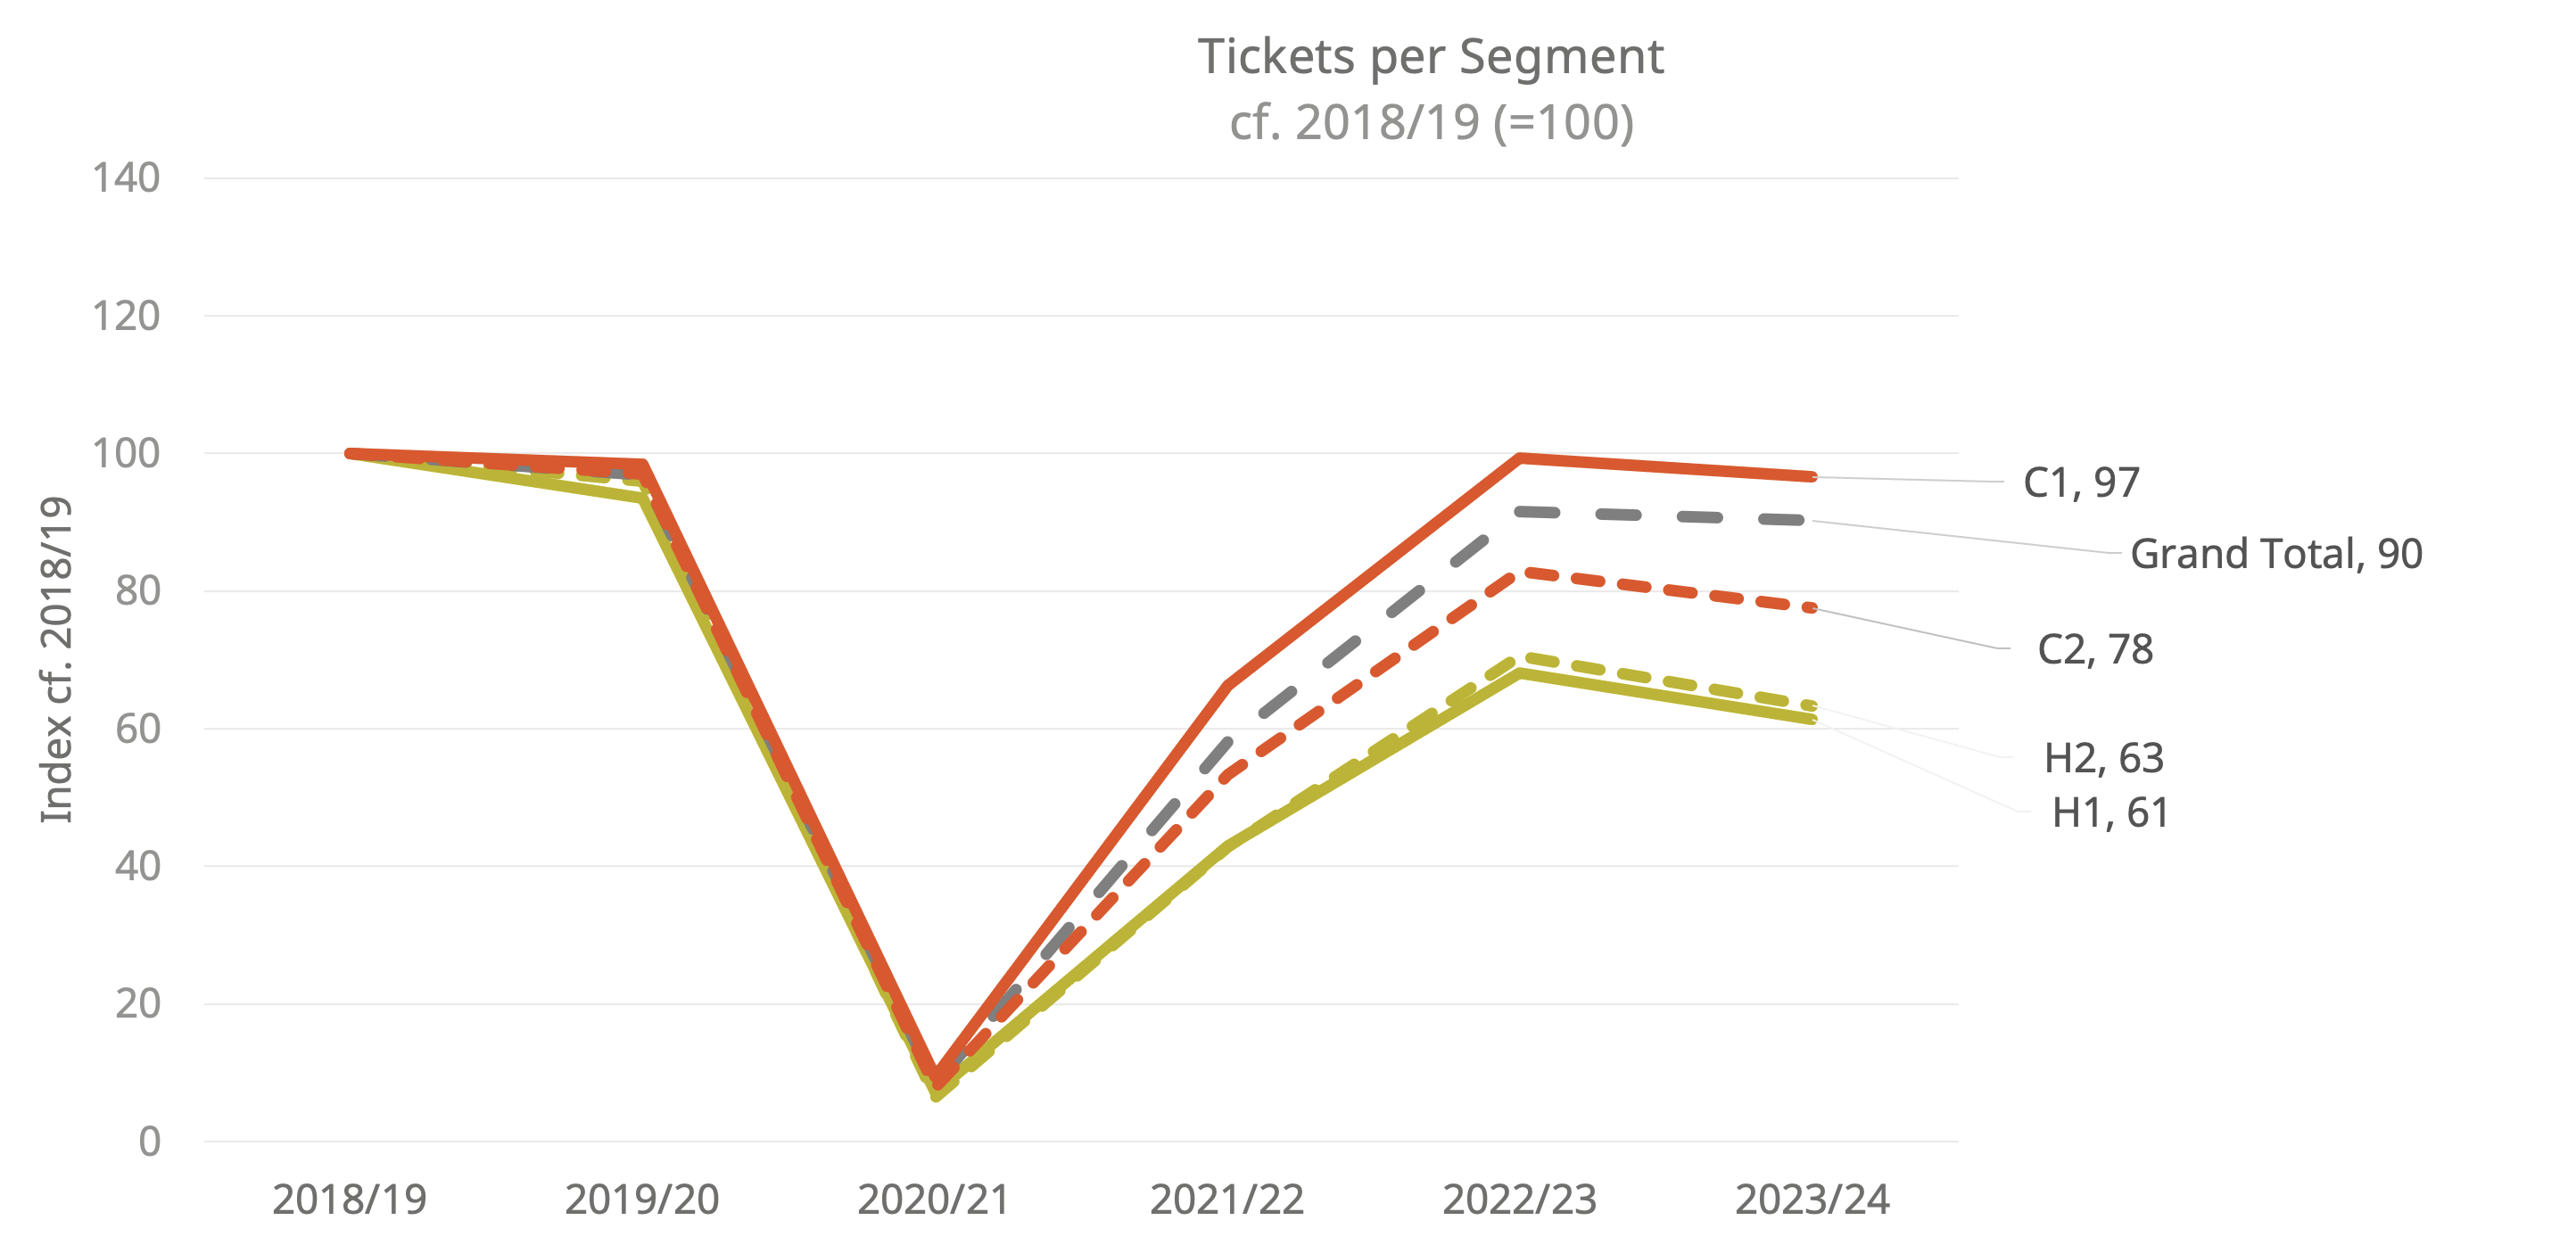
The segments that decreased most were Commuterland Culturebuffs and, especially, Home & Heritage. The latter dropped from being clearly the third to only just the fourth largest segment, with a 34% decrease. Once again, however, the picture is not uniform at a subsegment level. Whilst both H1 (‘Settled suburban seniors’) and H2 (‘Affluent residents of rural idylls’) decreased by similar amounts, the drop in Commuterland Culturebuffs is a combination of an above-average drop for C2 (‘Wealthy empty-nesters with comfortable lifestyles in rural areas’) and a below-average drop for C1 (‘Prosperous families living in the commuterbelt of major urban centres’). This suggests that some Commuterland Culturebuff audiences could be holding up well, whilst it is the older and more rural groups which have decreased most.

Implications
There are two key takeaways from this:
- The segments that have increased most are Frontline Families and Trips & Treats and that have decreased most are Home & Heritage and Commuterland Culturebuffs…
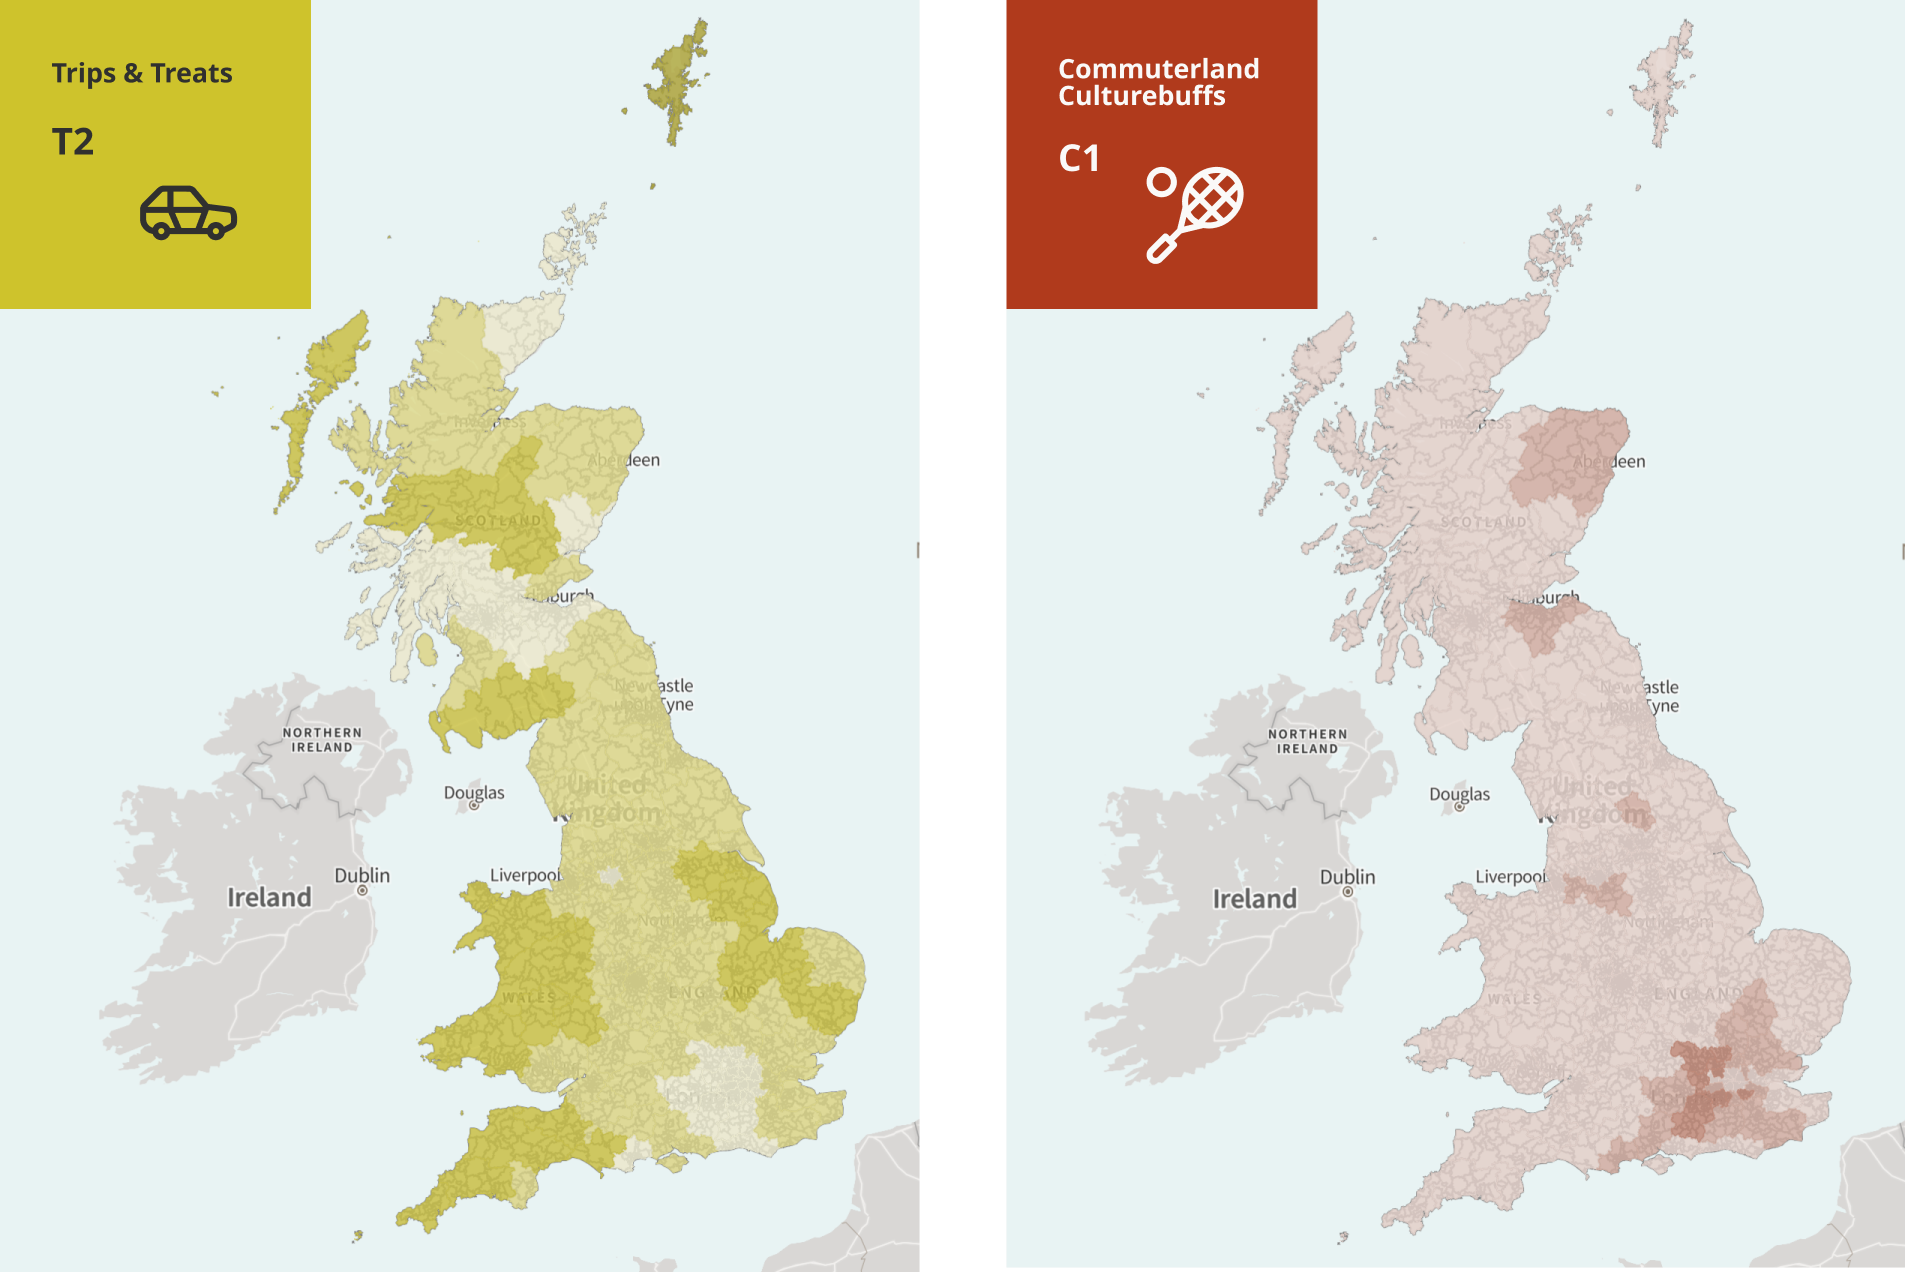
- …BUT for Trips & Treat and Commuterland Culturebuffs the subsegment really matters (T2 rose much less and C1 barely fell at all, and out-performed the overall audience: see the maps below for areas with higher concentrations of these subsegments).
More granularity for local areas is available on our Audience Spectrum Map.
And four suggested actions:
- Look at the Audience Spectrum profile (by tickets sold) of your audience (by using Audience Answers), for each year since 2018/19 and compare it to these trends – including the Audience Spectrum subsegments
- Look at the mapping for your local area and identify areas with concentrations of T1, F1 and F2 (potential areas with audience growth) and H1, H2, and C2 (potential areas with audience decreases). Check whether your existing communications/networks cover the growth areas as well as you might want — or whether you’re over-reliant on areas with decreases, since the shape of your local audience hotspots could be shifting…
- Look at the Audience Spectrum descriptions and Motivation Guides for the segments you’re reaching more of, to see how to attract more; as well as of the groups you’re reaching less than before, to see whether there are opportunities to retain them.
- Research your audiences - segmented by Audience Spectrum - to find out what the key barriers and motivations now are, and how they’ve changed (whether through a survey, focus groups or unstructured interviews).

