Summer Analysis
June 2021
Contents
- Why People Attend in the Summer
- Who Attends in the Summer
- What about Outdoor Arts
- What this all means
Themes
The profiles, behaviours and motivations of audiences who attend arts, culture and heritage in the peak summer months are distinct and strikingly aligned with how people engage over the festive period.
Why People Attend in the Summer
In general, the main motivation is ‘to be entertained’ (24%), to spend time with friends and family (15%) and because ‘[artform] is an important part of who I am’ (13%). Along with ‘to be intellectually stimulated’ and ‘to be inspired’ (each 6%), these make up almost 2/3 of main motivations (64%).
Summer, particularly August, is different. This is the only month where the most frequent main motivation switches, to ‘spend time with friends and family’ (20%), ahead of ‘to be entertained’ (17%). ‘[Artform] is an important part of who I am’ also drops (to 9%), but ‘to entertain my children’ and ‘to educate/stimulate my children’ both rise (from 4% to 7% and 3% to 6%).
Cultural attendance is August, then, is more about other people (spending time with them, or providing them with stimulation/enjoyment) and less about ourselves (our own enjoyment, or sense of self).
Incidentally, the other notably different month is December. This follows a similar pattern to August, except that ‘to be entertained’ is as high as usual (not lower) and ‘for a special occasion’ rises to greater prominence (7%, cf. 4% overall), with ‘educate/stimulate my children’ lower. There is a stronger emphasis on fun at Christmas, along with spending time with others. Motivations are a little more concentrated, too: 69% coming from the top 5 motivations (cf. 64% overall and only 60% in August).
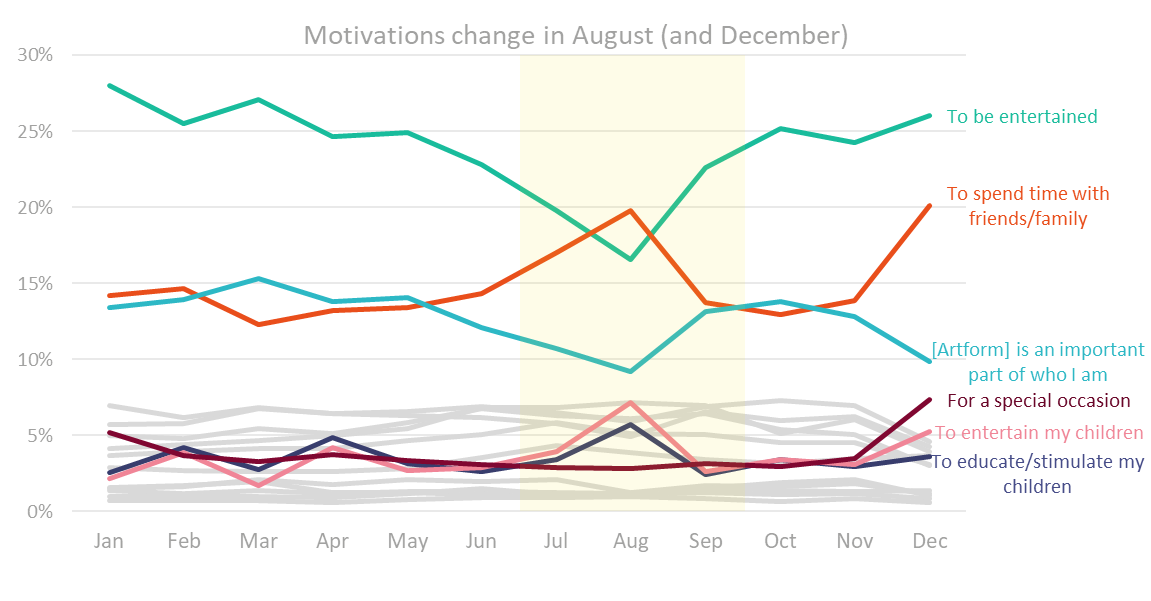
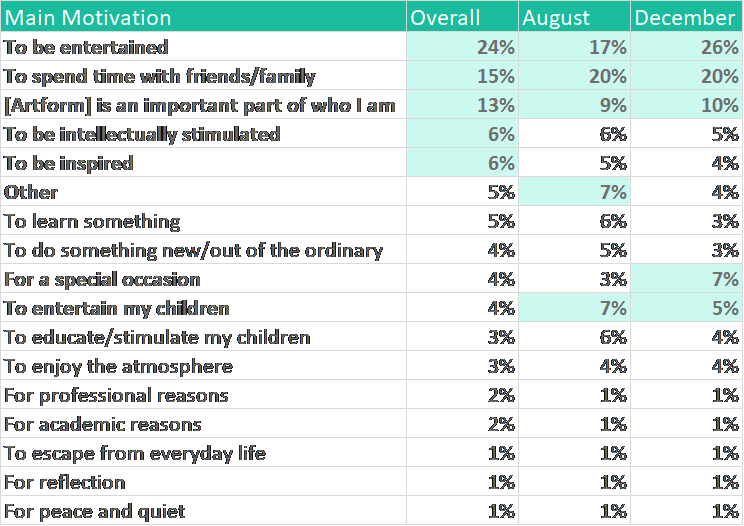
(top five motivations for each time period highlighted).
Shifts in motivation through the year reflect shifts within activity types, as well as shifts in the proportions of activity types at different times of the year. Many types of activity follow the overall pattern throughout the year, with dips in ‘[Artform] is an important part of who I am’ and desire ‘to be entertained’ in Summer, and rises in ‘spending time with friends and family and child-related motivations [whether to educate or entertain them].
There were, however, exceptions. Focusing on a few types of activity as examples:
- Outdoor Arts and Plays/Drama saw increases in the proportion saying their main motivation was ‘to be entertained’ in the Summer, but Music, Museums and Contemporary Visual Arts were fairly flat across the year.
- ‘[Artform] is an important part of who I am’ also stayed fairly flat for Contemporary Visual Arts and Museums in the Summer.
- Outdoor Arts went against the trend for other motivations too: with higher peaks at other times of the year for ‘Spending time with friends and family’, for ‘Educating children’ [esp. autumn and February] and even for ‘Entertaining children’ (which was second-highest in August, behind a particular peak in April (i.e. Easter holidays).
Who Attends in the Summer
Summer visitors are almost twice as likely to be first time visitors, with the number of lapsed visitors [i.e. those who have attended before, but not in the past 12 months] remaining fairly constant throughout the year1:
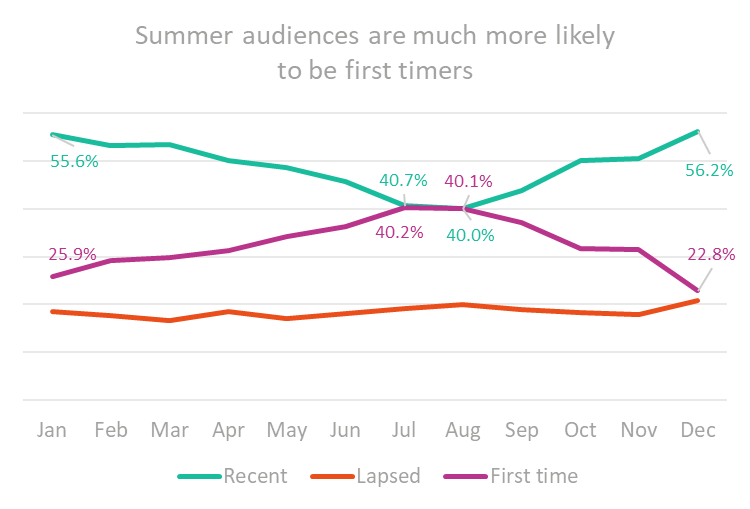
Most types of activity follow this pattern, with a peak of first time visitors in August, although Musical Theatre and Plays/Drama peak slightly later (in September), whereas a couple of art forms see the peak in April to June, such as Traditional Visual Arts and Dance (with Plays/Drama and Contemporary Visual Arts peaking around July).
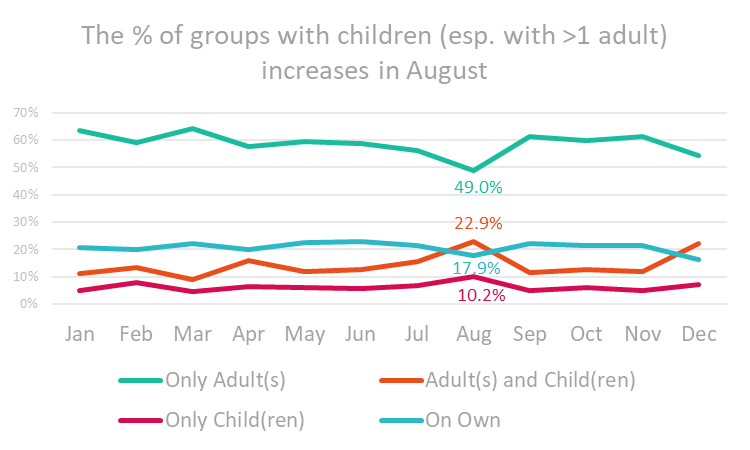
Summer groups are also larger (with a lower proportion of single visitors or visitors in couples)…:
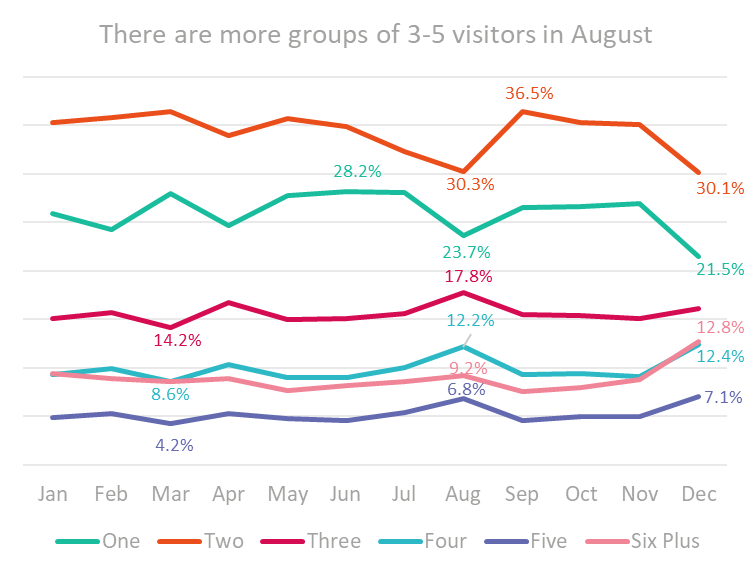
However Music has a higher proportion of solo attenders in August than other months (39% compared to 23% for the year on average), as does Plays/Drama (32% compared to 21%).
Summer audiences are more likely to contain multiple adults as well as children, as the following summary of who visitors attended with shows:
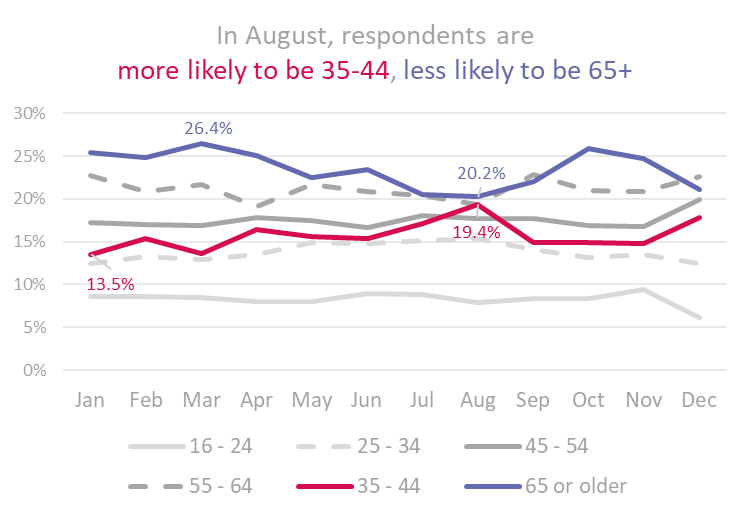
Similarly, August audiences are more likely to be 35-44 (i.e. the peak age for children in the household) and less likely to be 65+, compared to the rest of the year (although there are still more of the latter than the former in absolute terms):
The profile of August attenders also shifts towards middle and lower engaged family groups:
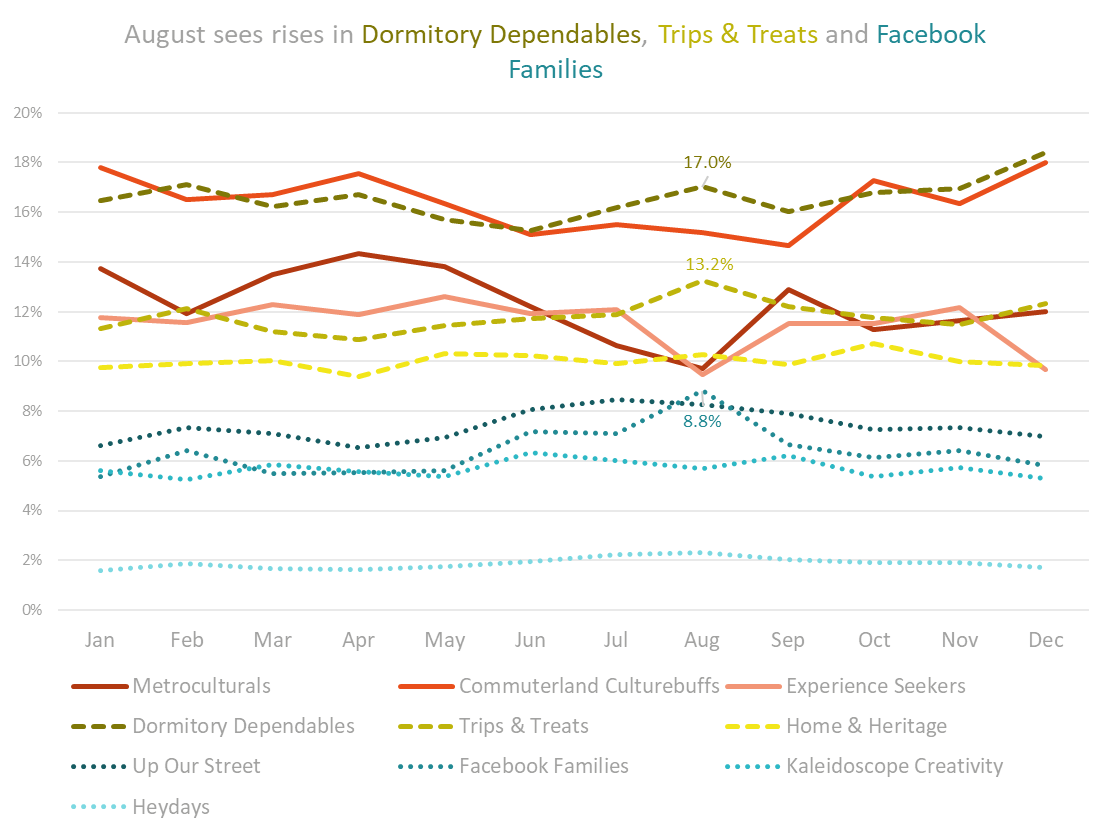
(Higher engaged groups = solid line; medium engaged groups = dashed line; lower engaged groups = dotted line)
Respondents are also more likely to be from overseas in the Summer, although more in July than August. The following chart shows the proportion of respondents who were from outside the UK in each month, with proportions double in July compared to February:

Domestic attenders are also more likely to have travelled further in late Summer, peaking in September (the following chart is based on the distance travelled based on the postcode of respondents relative to the venue attended):

This is largely due to changes in the proportion of the most and least local audiences, rather than an overall dilation of the distances travelled, as is evident when looking at the change in proportion by drive time bands:

What about Outdoor Arts
From the Cultural Participation Monitor (a representative survey of the UK population carried out in waves through the pandemic), we can see more about public engagement with Outdoor Arts.

In the year before COVID, 32% attended Outdoor Arts, falling to 3% in the year since (from Wave 2 data, February 2021).
Of these, 30% of attendances were within a mile, 33% within one to three miles and 30% from further afield (with 7% ‘not sure’), indicating a very local audience (for contrast, the equivalent figures for performing arts events were 18%, 40%, 38% and 6%). 98% of respondents from the Audience Finder surveys also indicate that they are from the UK, rather than overseas.
The choice of who to attend with also stayed close to home, with ‘other adults I live with’ the group attended with by most people.

The type of group attended with as a proportion of visits can be seen from the Audience Finder surveys:

The most notable difference was the increase in the proportion of visits with children, particularly as part of a group including other adults (who, as we can see from the previous figures, are much more likely to be adults from the same household). Combining date from these two sources gives a more rounded view of who people ever, or typically, attend with.
Given the higher proportion of visits with children, it is unsurprising that there are a higher proportion of 35-44s among adults in the Outdoor Arts audience:

Outdoor arts has a higher proportion of first time visitors than overall, at nearly a half, rather than a third, showing how it reaches beyond currently-engaged audiences:

This is linked to Outdoor Arts also reaching a more representative audience profile than other arts and culture (as included in Audience Finder); indeed, it has a higher proportion than the UK population for some typically lower-engaged groups:

Most people attend Outdoor Arts to spend time with friends and family, for entertainment, to enjoy the atmosphere, or to do something new/out of the ordinary, accounting for 62% of respondents between them:

The top two ratings for Outdoor Arts match those for August overall, but there is a stronger emphasis on novelty and atmosphere (interesting, for August itself, Outdoor Arts reports equally high proportions mainly motivated by those top two reasons, showing a move towards entertainment as a motivation in that month, rather than away from it, as happens overall).
Satisfaction with Outdoor Arts events was high, with almost no negative ratings of the overall experience.

Respondents, who had attended Outdoor Arts events in the pandemic were similarly positive about COVID safety measures.

What this all means
In Summer, expect visitors to be:
- Less familiar with venues and content and from groups which are typically lower engaged than your core audiences, or from overseas or further away. This could mean it would be useful to:
- Ensure signage is clear and there is a clear, warm welcome
- Review summer information and signage for any assumptions of prior knowledge or ‘insidery’ language (this is of course a good idea at other times of year as well, but particularly in Summer)
- Clearly and simply signpost how to keep in touch with you, for new audiences, in ways that are relevant to them (e.g. ‘for more information about our summer events, find us on facebook: like our page to keep in touch’).
- Ensure that any language requirements are met
- More likely to be looking for entertainment and shared experiences with family members (i.e. its more about them than about you). You may therefore want to:
- Ensure programming is focused on those needs, and that they are clearly communicated
- Create opportunities for that family experience to connect to your organisation (e.g. identify and augment great photo opportunities, encourage creative activities to produce something to take away and treasure, plan events to allow interactivity between family members).
- Attending with children, and in larger groups (with more middle aged than usual, and fewer over retirement age). You may wish to:
- Ensure that food and drink options are targeted at younger attenders, or include multi-buy options
- Make sure you provide clear gathering points, as well as ample seating/table areas and baby-change facilities
- Particularly focus on ensuring that facilities and offers are as inclusive as possible (if one person in a large group can’t attend, or find something to eat, for example, it’s both a barrier for them and may put off the whole group).
- For many more suggestions for engaging family audiences see… [Learning Diaries? Route maps? Etc]
Summer audiences are also similar in many ways to Christmas audiences (in terms of larger group sizes, more family groups, motivations etc). There is potential to:
- Encourage crossover between the two times of year
- Use these two times of year as key moments for attracting new audiences, who may then crossover to other events (with suitable promotion)
- It may also be possible to get clues from what works well at one time of year, for what would work well at the other, once you look past the immediate ‘Christmassy’ or ‘Summery’ features. For example: are there elements of panto that could translate into summer events? Are there things that work at a summer festival that could be translated into a festive version…?
Outdoor arts audiences are particularly likely to first timers, or from a broader profile of visitors, as well as attending in family groups, so may of the same suggestions apply. See these tips for more outdoor inspiration:
Do remember, though, that not all art forms or activity types are the same in the summer (for example Music audiences party sizes become smaller, with no diminution of ‘entertainment’ as a motivation. There will also be variations for particular places and individual organisations. While it’s useful to know the big picture, it’s also important to know the localised and individual context. You can use your own Audience Finder survey responses, or profiling of audience postcodes, to get insights that you can compare this way.
