Sales changes: an overview
August 2024
Contents
Themes
It’s been a changeable few years for ticket sales in the cultural sector. What we’d initially hoped would only be a sharp ‘V’ shape in ticket sales, with a quick rebound after a one-off bad year due to the pandemic, has turned into something more complex…
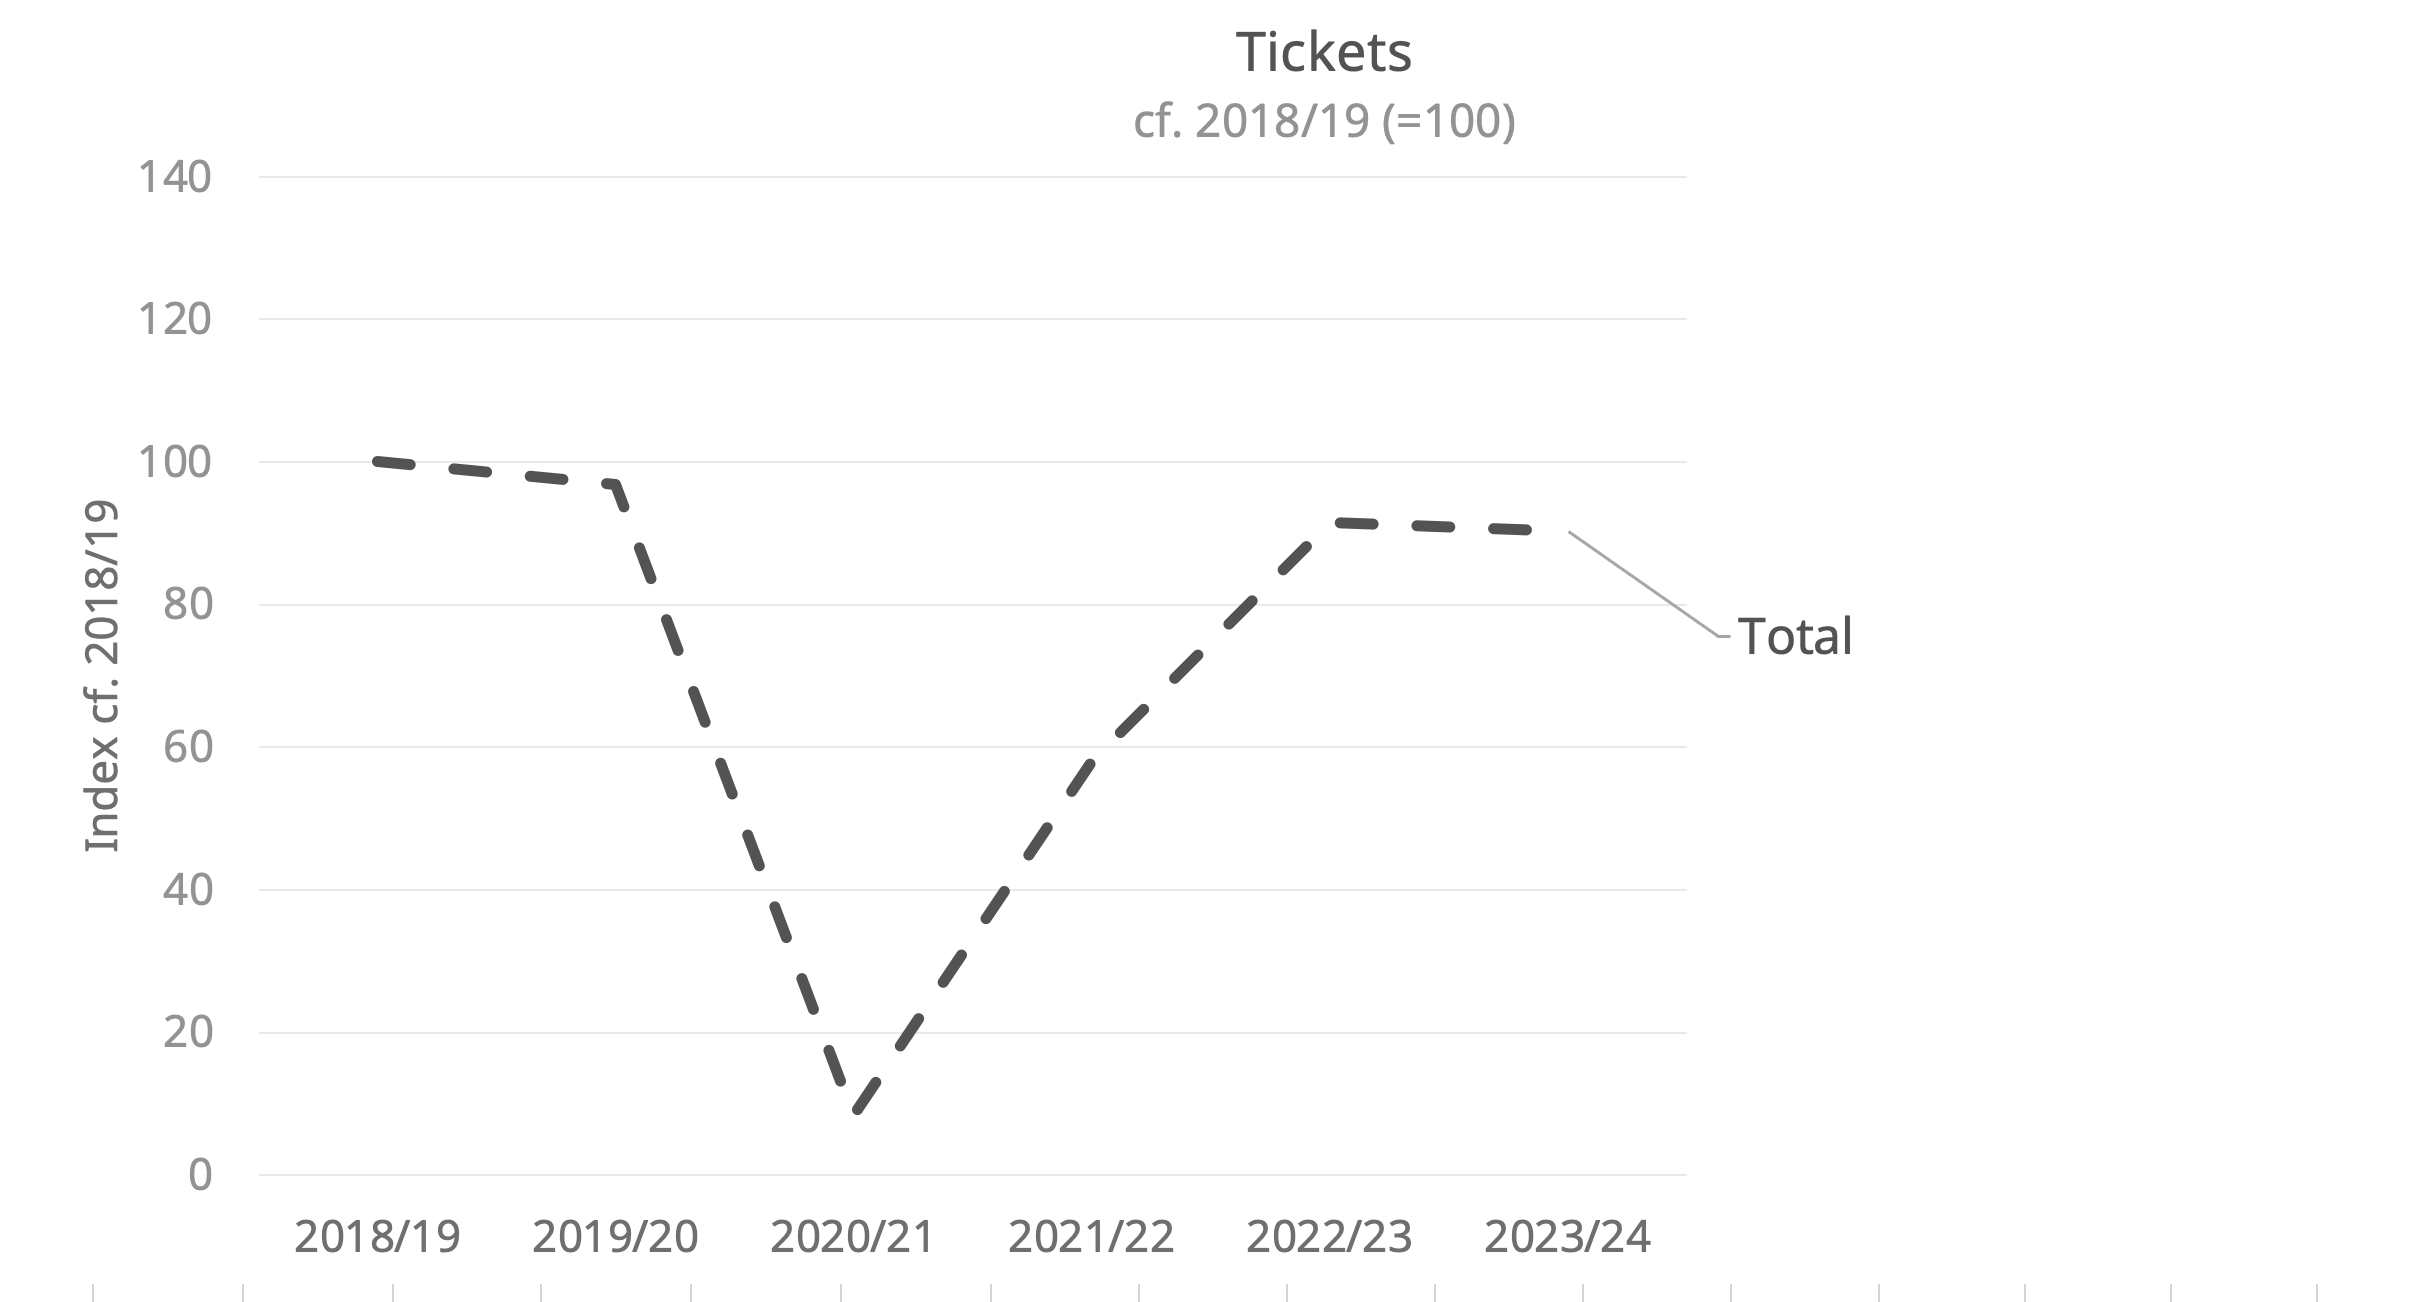
Tracking the changes year by year (comparing the number of tickets sold by a consistent group of 250 organisations from Audience Answers to a baseline year of 2018/19) we can see that:
- sales already slipped slightly in 2019/20 (with the first effects of the pandemic catching the final months of the year);
- Sales then dropped sharply for the first year of the pandemic;
- recovering partially in 2021/22 (up to about 60% of 2018/19 levels);
- rebounding further in 2022/23 (to around 90%) but, rather than recovering fully, then…
- falling back as the cost-of-living crisis bit in 2023/24.

Of course, there are variations on this pattern (by organisation or by types of organisation or artform). But the aggregate picture is one where ‘the recovery’ has never fully arrived. Since it has for some sub-sectors, perhaps this period can be understood as a shift away from the types of venues and product that are mostly measured through Audience Answers (with higher proportions of publicly-funded venues, for example), towards larger-scale and more commercial fare.
The Differences by Audience Types
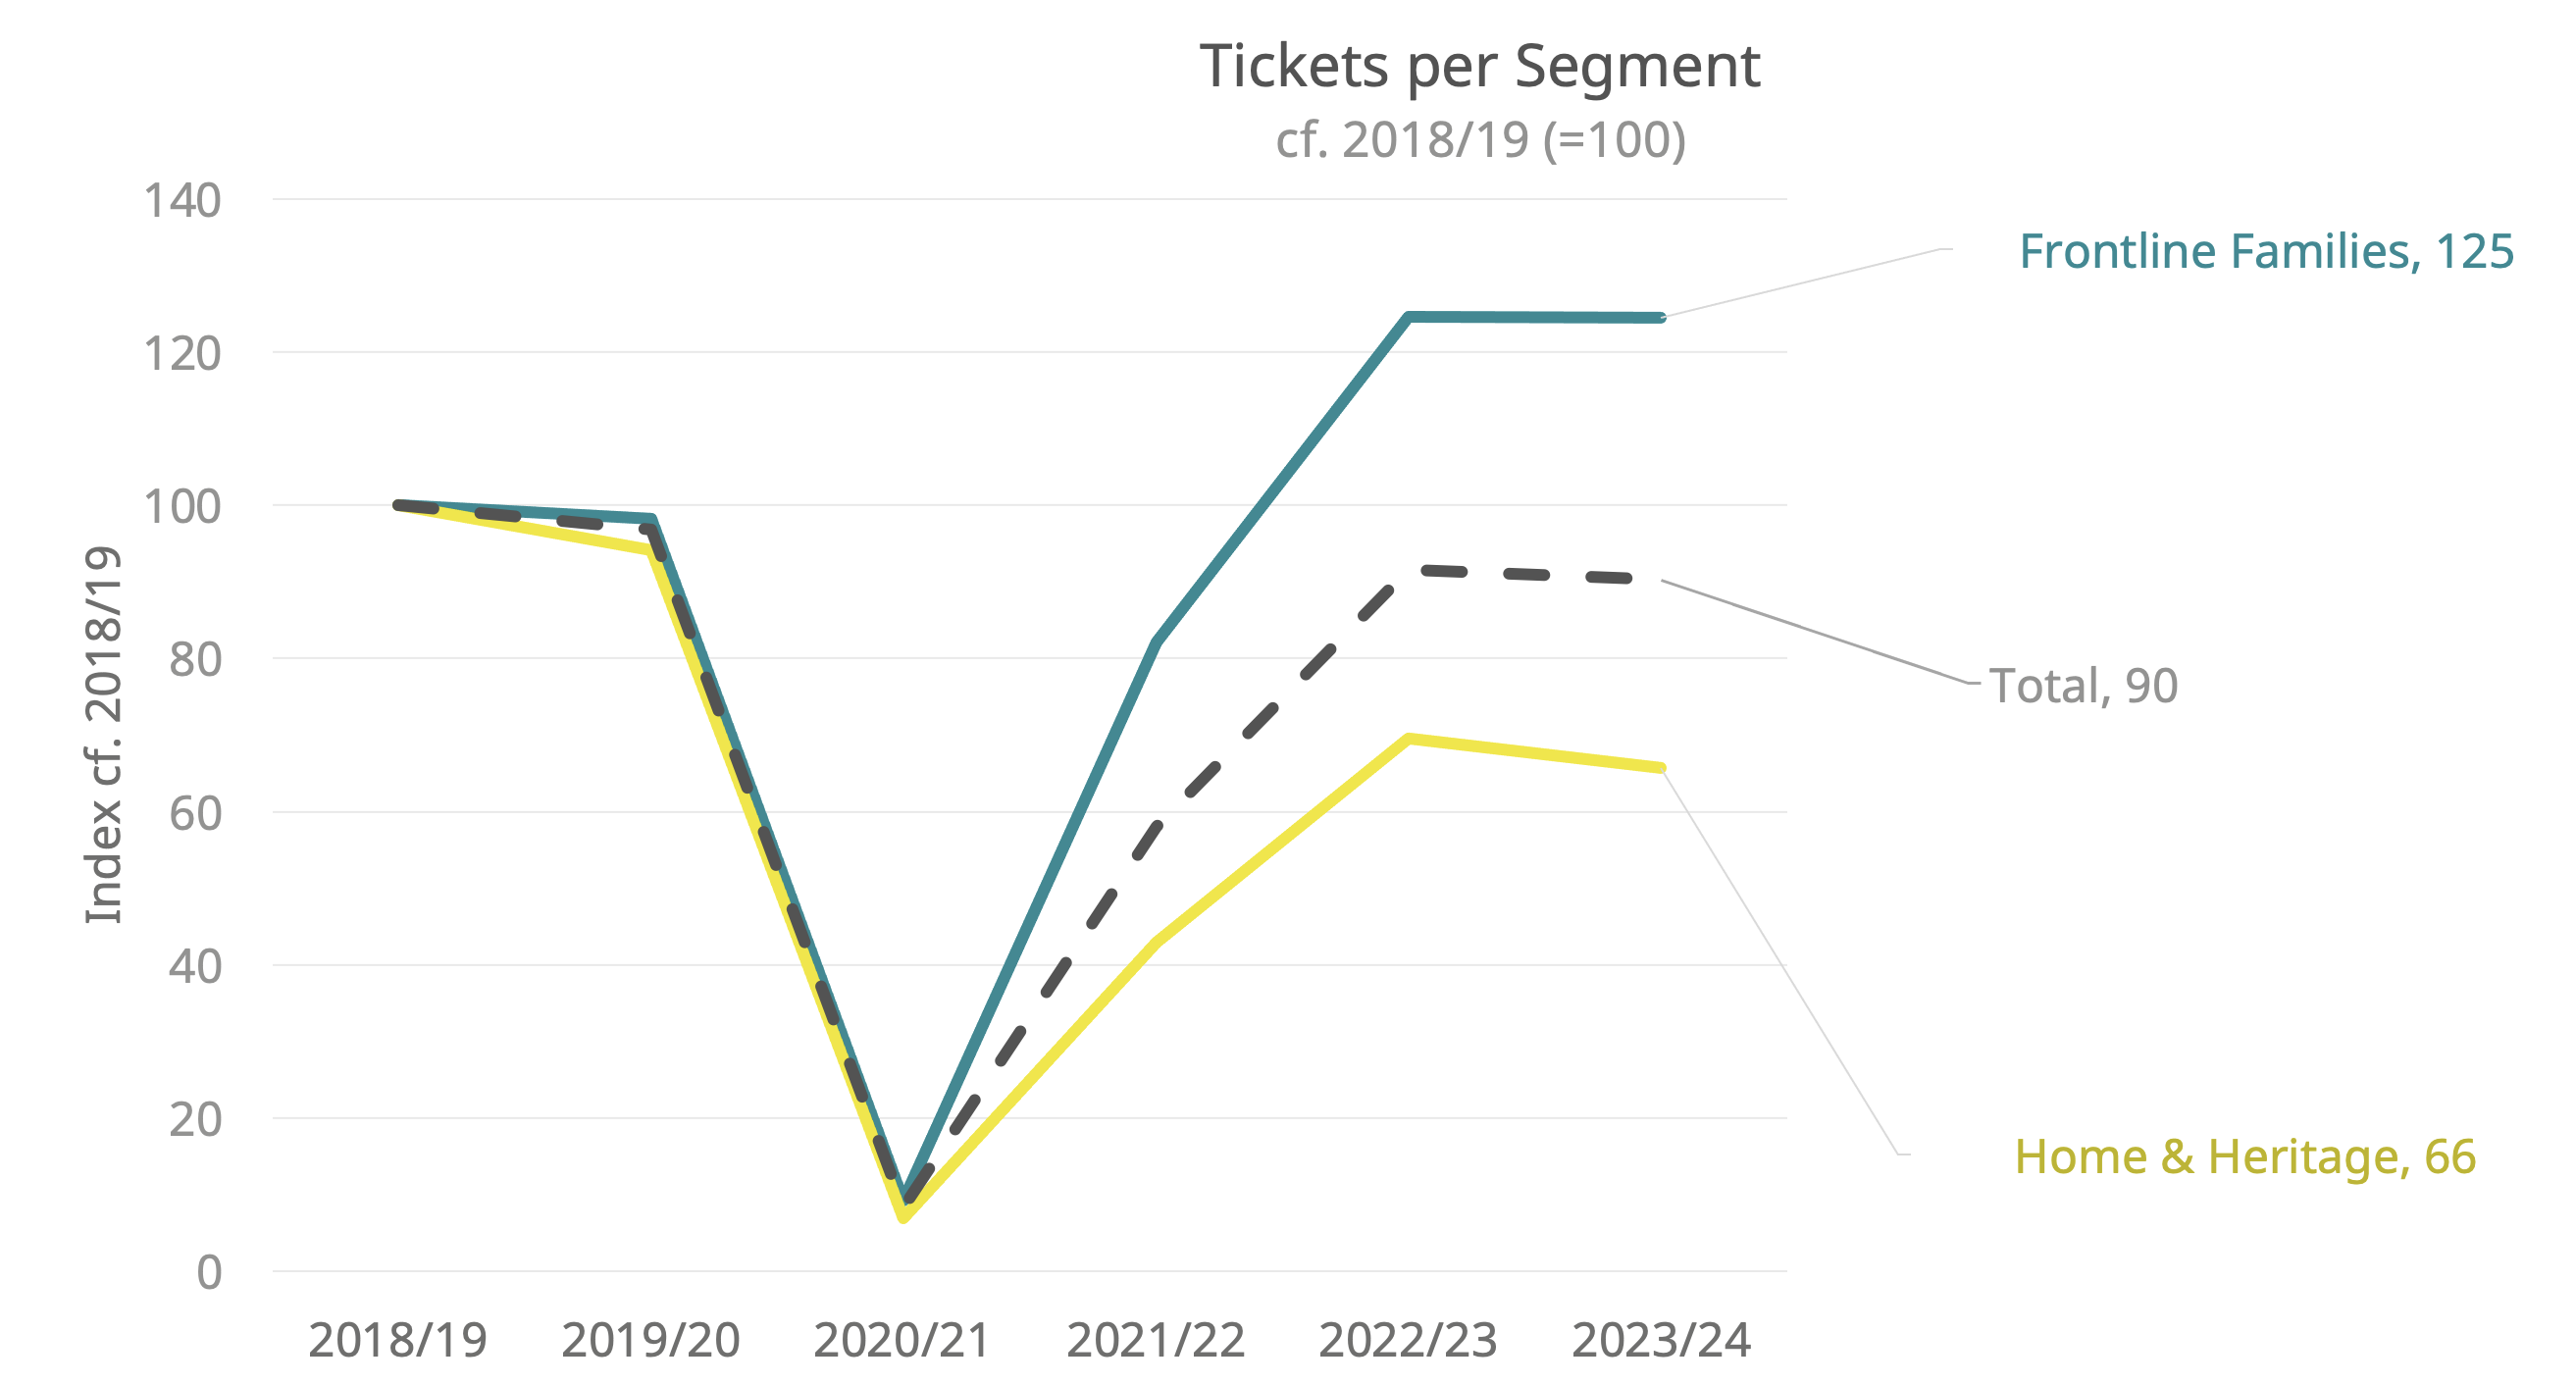
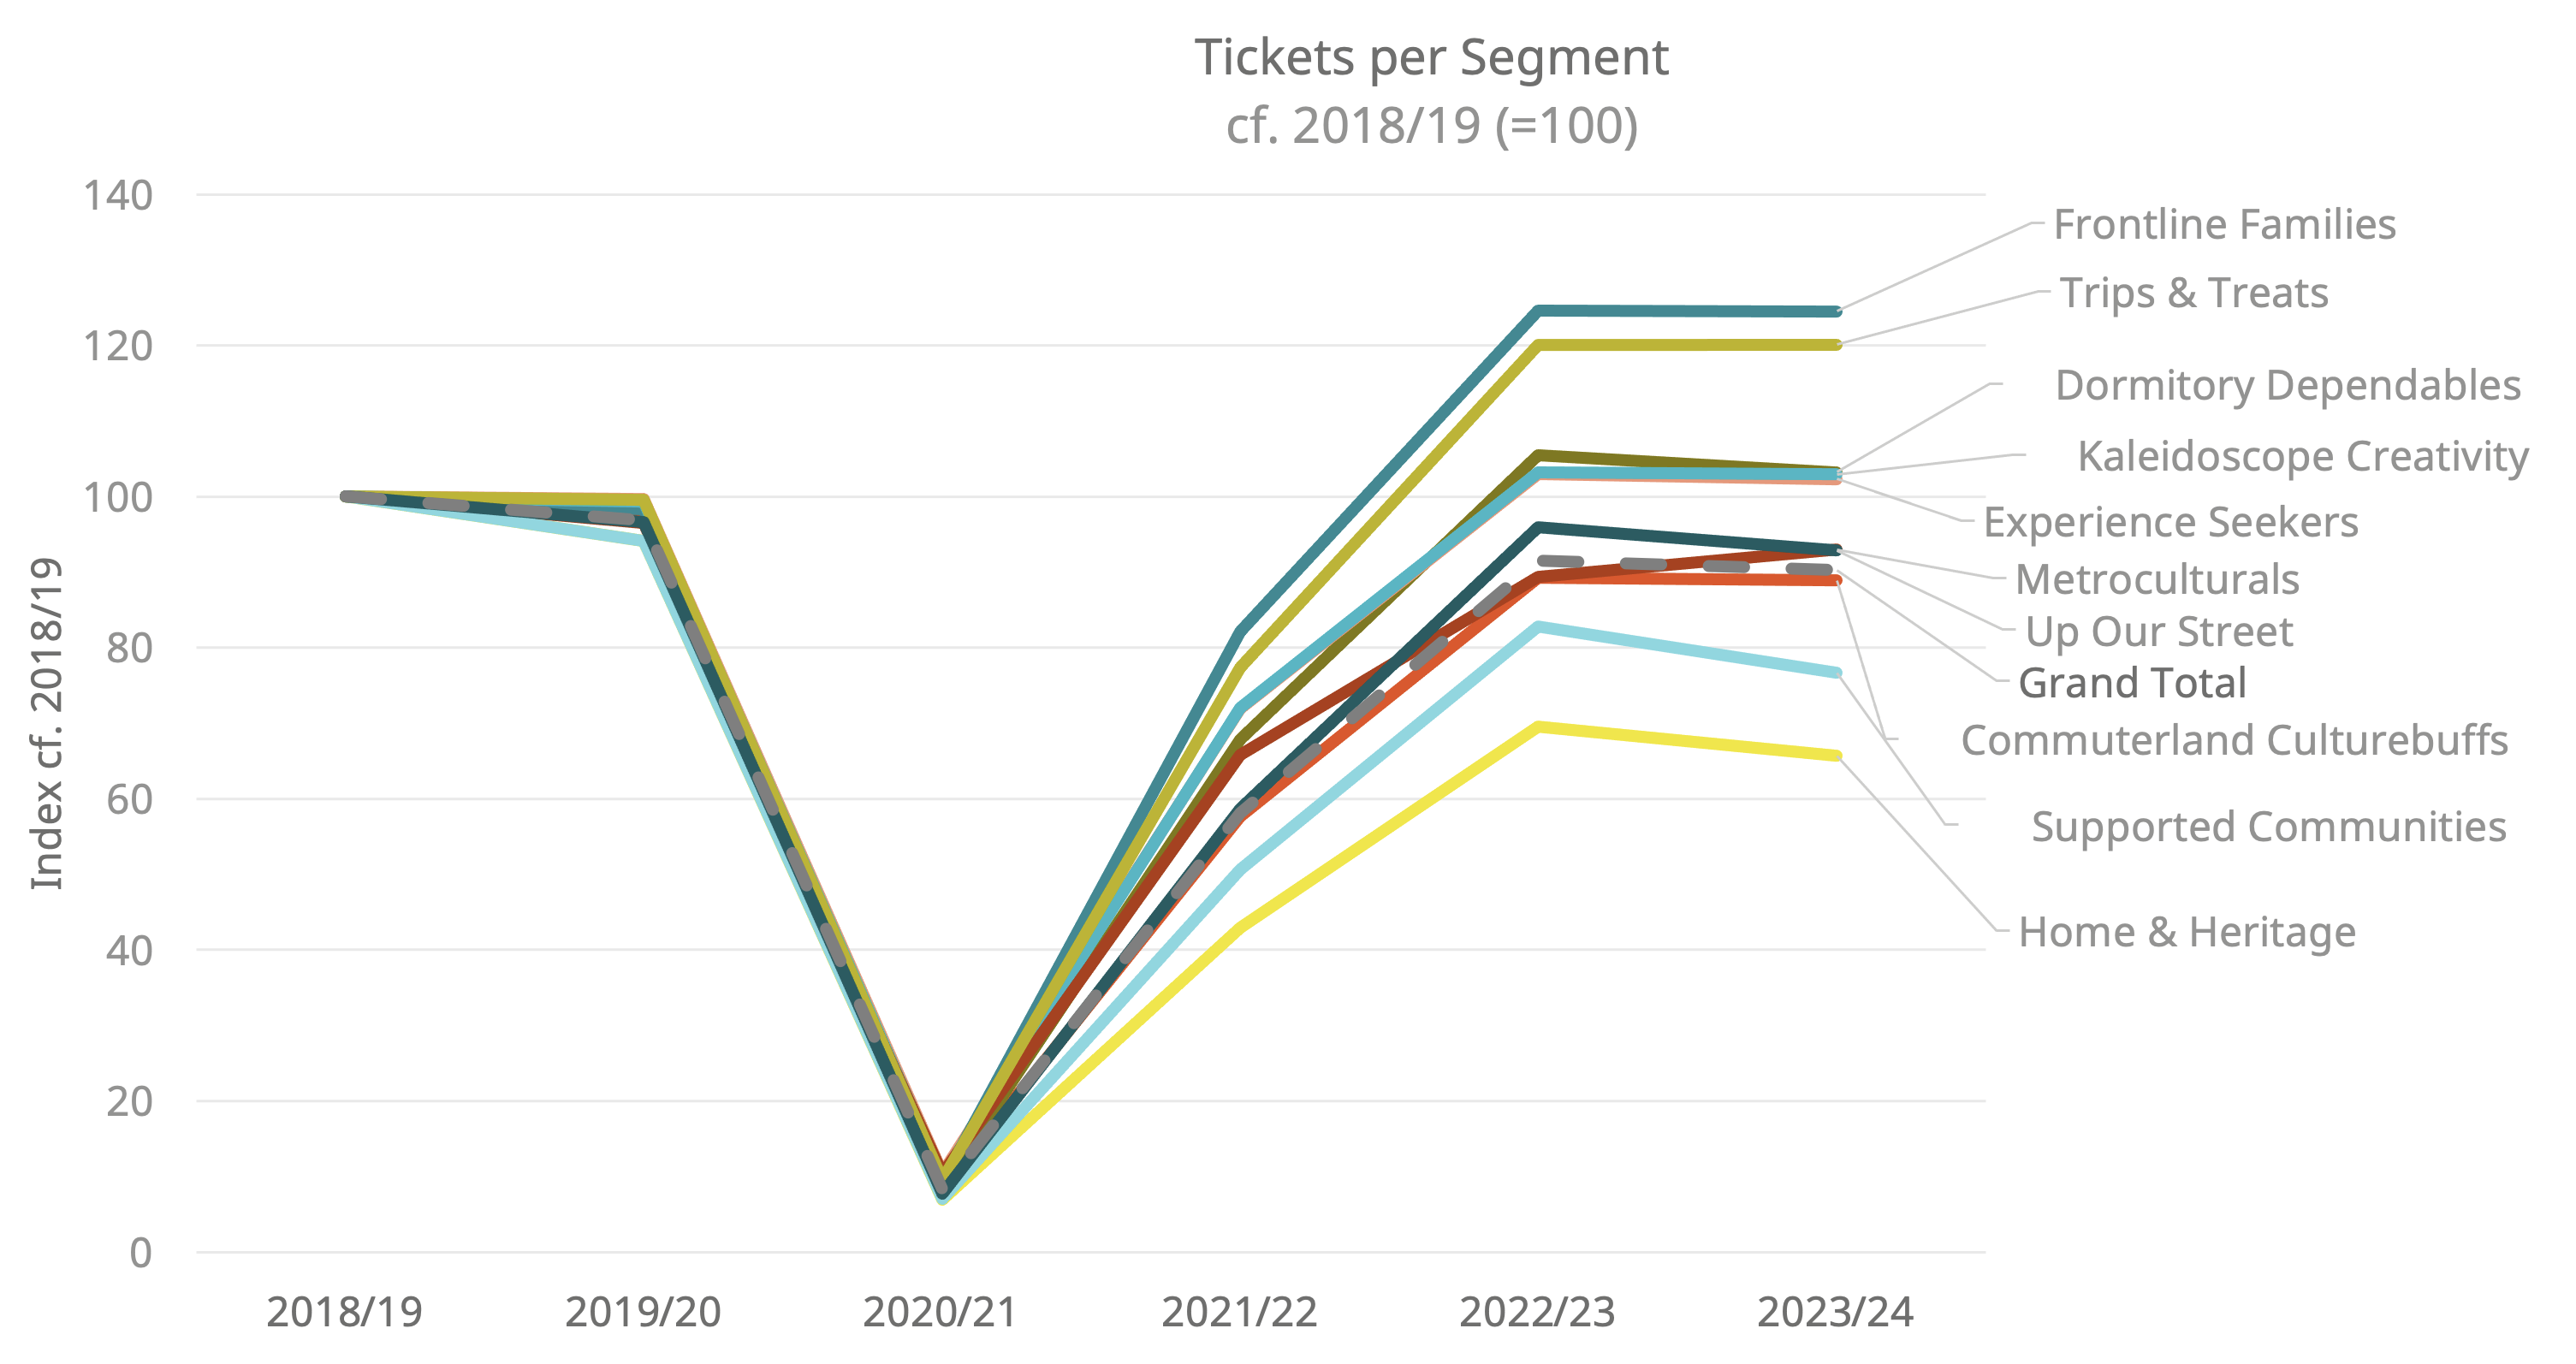
As well as a difference by venue, there is also considerable difference by audience segment. Using Audience Spectrum we can see that some segments increased by 25% on their 2018/19 levels; other decreased by 34%.

Overall, we saw a shift in Audience Spectrum segments towards segments with higher proportions of families and those with younger age profiles and more mainstream tastes, and away from those that were middle- to higher-engaged but older and with lower proportions of families and more traditional tastes. Specifically, we saw growth among Frontline Families (+25%) and Trips & Treats (+20%); decreases among Home & Heritage (-34%), Supported Communities (-23%), Commuterland Culturebuffs (-11%), Metroculturals and Up Our Street (both -7%, above the overall figure of -10%). The other three segments grew by 2-3% on previous levels.

Implications
These substantial differences by audience group mean that changes over the last five years are likely to be notably different for different organisations, based on their previous audience profile, the profile of their local area and the extent to which they have attempted, or been successful in, appealing to different audience types. It also suggests that these cultural organisations have developed an audience profile that is closer to the population (with less prominence of ‘highly-engaged’ groups), but that this has coincided with a reduction in overall audience volumes.
Further, it suggests that certain types of programming (and hence organisation) are likely to prove more successful, and be a larger proportion of the sector, than others - notably, those with broad family appeal (including both those with low costs and barriers to engagement and also those which, even if higher costs, are ‘known quantities’ e.g. with recognisable names or brands). Organisations and events that appeal to culturally engaged audiences, relying on existing specialist knowledge and traditional tastes, are likely to be at a greater disadvantage.
