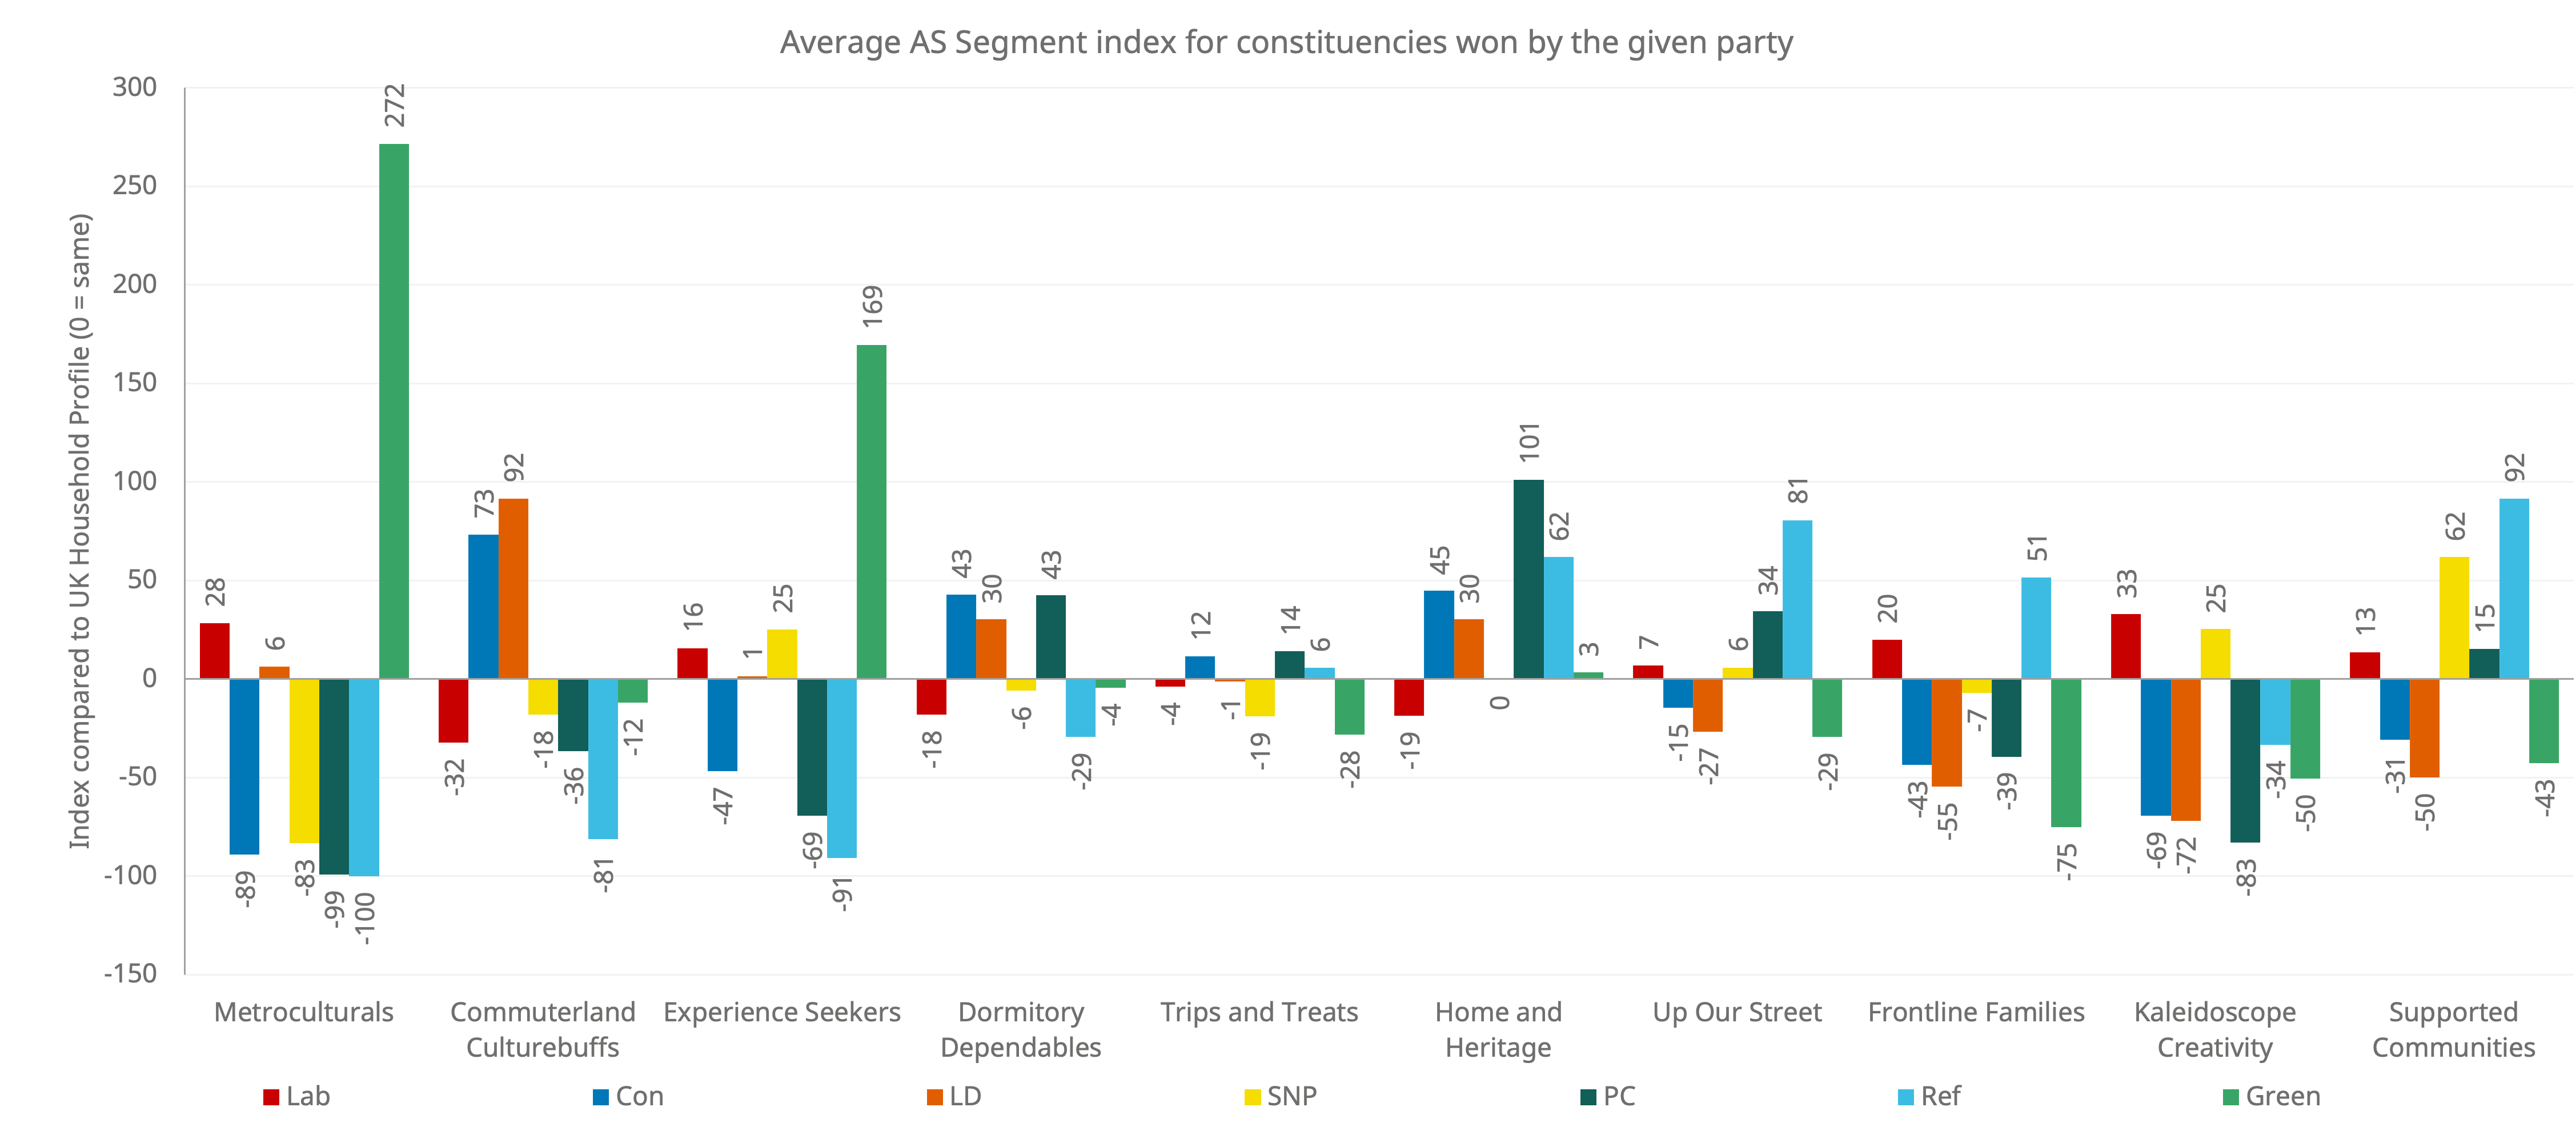
Comparing over-represented Audience Spectrum Segments in seats won in the 2024 General Election
July 2024
Themes
Gain a deeper understanding of the 2024 election with our Audience Spectrum Analysis, where we break down the profile of each party's seats compared to the national average, revealing key trends and the demographics each party represents.
Not familiar with Audience Spectrum, our powerful tool for segmenting UK cultural audiences?
The following chart shows the Audience Spectrum profile of the seats won by each party, compared to the overall national profile, with the index figure showing the amount it is above or below the average (0 = the same, 100 = double etc).
Unlike the other article comparing the Audience Spectrum profile of the seats won by each party overall, here we focus on which groups are most over-represented. This allows us to set aside which groups are larger because they’re a larger splice of the overall population, and focus on which are comparatively concentrated in each party’s seats. This makes a particular difference for smaller segments which have strong concentration in a particular party’s seats (e.g. Metroculturals in Green seats). In some other ways, of course, there will be similarities across the two ways of looking at the figures, but where there are differences, they can be usefully complementary…

The key headlines:
Labour was most broadly similar to the UK population overall. Of course, their result might be expected to be more similar to the average because they won most seats. They have a lower proportion of constituents in (especially affluent) rural areas and are a bit higher in urban, metropolitan and areas of lower arts engagement. But Labour MPs now have constituents who largely represent the country as a whole.
Older high and medium arts-engaged groups were the only segments over-represented in seats won by the Conservatives: super-engager Commuterland Culturebuffs and medium-engaged Dormitory Dependables and Home & Heritage. Losses in central London (e.g. Kensington & Chelsea) will have pushed down the proportion of Metroculturals, for example. The Conservatives also performed less well in areas with higher concentrations of typically younger groups.
The Liberal Democrats are in some ways the surprise package. Rather than being ‘metropolitan liberals’, they were in fact over-represented in seats with the same three segments as the Conservatives (Commuterland Culturebuffs, Dormitory Dependables and Home & Heritage), emphasising the extent to which they focused their campaign on previously-Conservative seats. They were even less likely to have constituents from the lower-engaged groups (but around average for highly-engaged Metroculturals and Experience Seekers).
The profile of the SNP’s constituents reflects in part the differing profile of Scotland to the rest of the UK (e.g. winning seats with higher proportions of Kaleidoscope Creativity) but more seats with higher proportions of younger Experience Seekers and Supported Communities. The low proportion of Metroculturals also reflects them being shut out of the central belt (especially Edinburgh).
Reform seats have strikingly low proportions of all of the higher-engaged segments, with a strong concentration among older middle- and low-engaged groups (Home & Heritage, Up Our Street and Supported Communities) as well as Frontline Families. This high variation from the average reflects their limited number of seats and the profile reflects their concentration largely in lower-income coastal towns.
Seats won by the Green party are in areas with higher concentrations of Metrocultural and Experience Seekers, with the two highest indices of all parties for these groups.
Plaid Cymru are particularly concentrated in seats with large Home & Heritage populations, reflecting the population of rural Wales.
Overall there is most variation for Metroculturals and least for Trips & Treats, reflecting their different levels of geographical concentration.
This exercise, although mainly a bit of fun, does show that the real and substantial difference between segments are reflected in other areas of life where values and behaviour are involved. It also gives an indication of the groups that MPs are representing, when they are looking at issues around cultural policy (although they may also be targeting group that they do not currently represent, or taking particular positions for reasons other than their appeal to their own constituents, of course).
