One Chart, Twenty Two Stories
November 2025
Contents
Themes
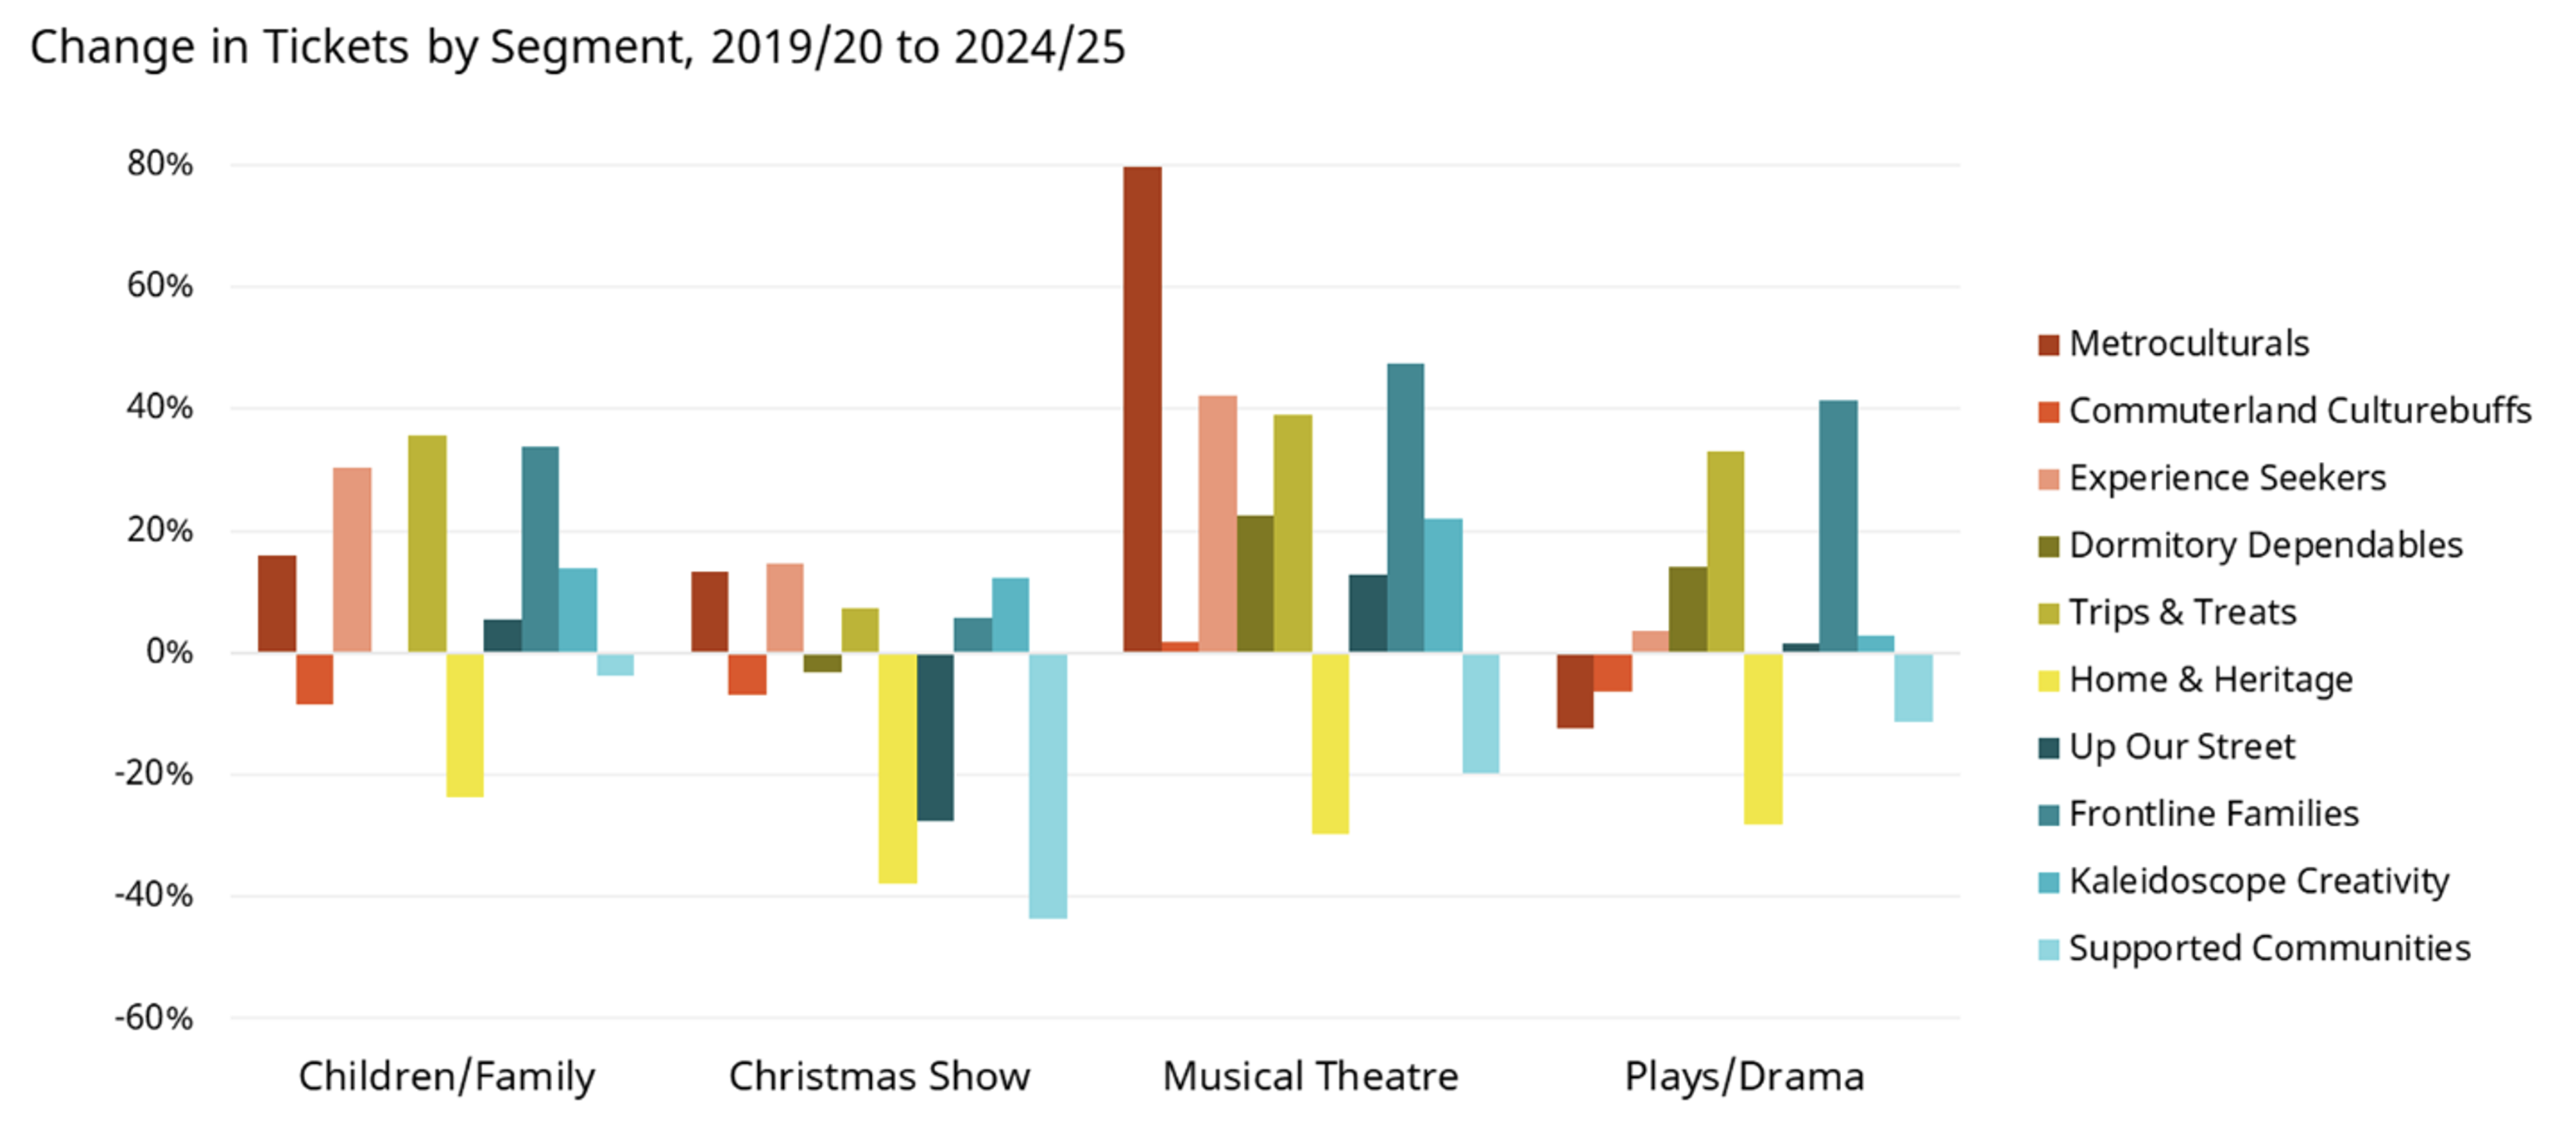
In the introduction to October’s TEA Break, we briefly shared a chart showing the percentage change in the number of tickets purchased by each Audience Spectrum segment from 2019/20 to 2024/25, for four art forms.
These artforms were:
- Children/family
- Christmas shows
- Musical theatre
- Plays/drama.
We then went on to talk about each of those four artforms in more detail (it was a busy session!).
But let’s look at that chart again, seeing how many stories it can tell…
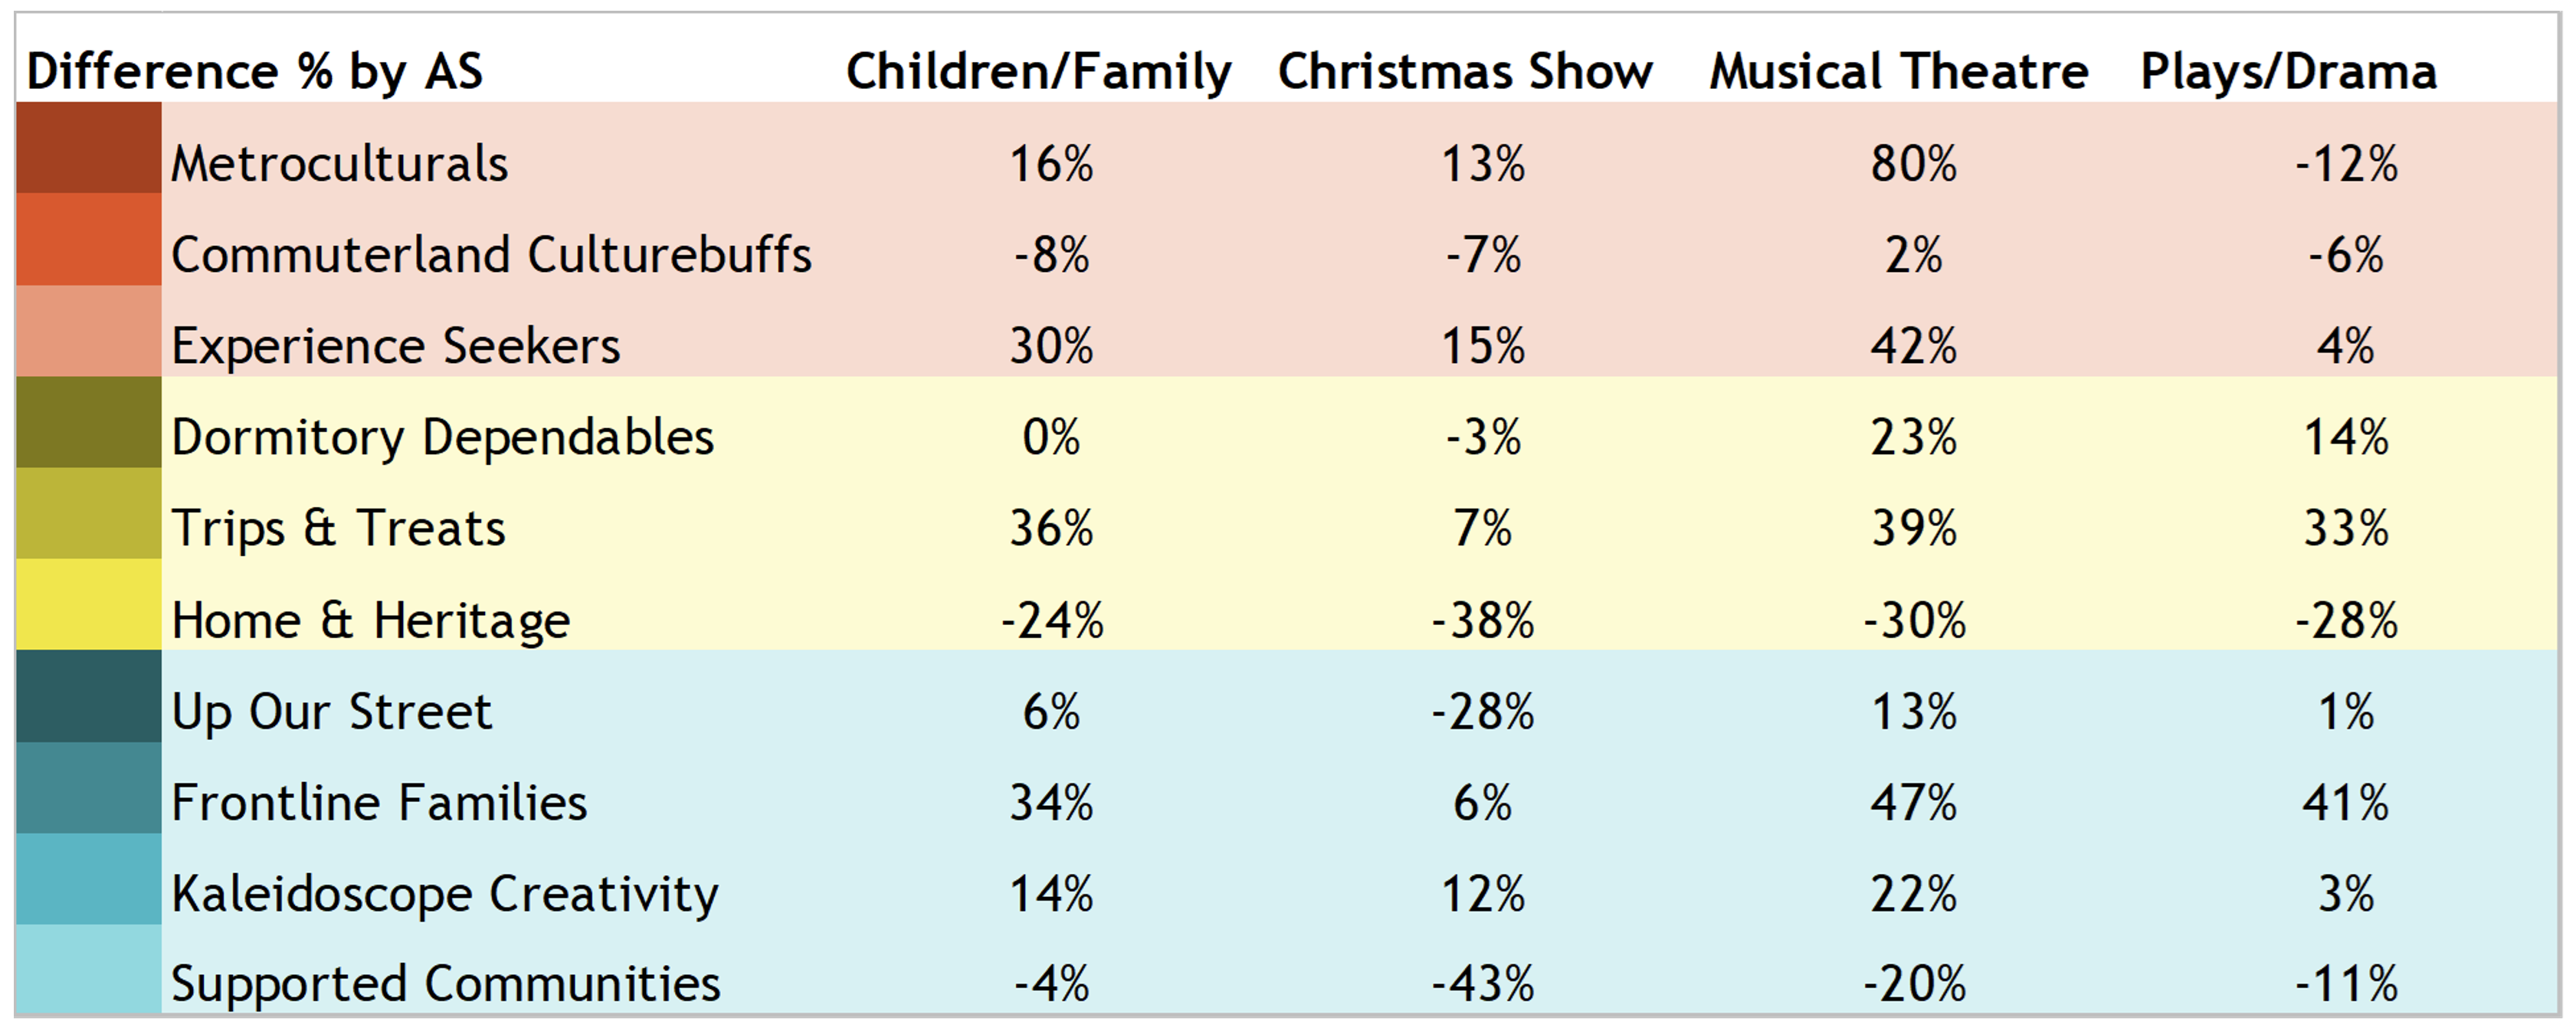
The chart (and a table of the data)


The Stories
Here then, are twenty-two stories that this one chart tells us:
- There is wide variation of change across segments and artforms (A range of 123%, with the highest +80% for Metroculturals to Musical theatre and the lowest -43% for Supported Communities to Christmas shows)
- No artform shows all segments growing or decreasing (there is a range of at least 58% [for Christmas Shows] and as high as 110% [for Musical theatre] between the highest and lowest segments for each artform)
- Only two segments have decreased across all for artforms: Home & Heritage and Supported Communities
- The segment that decreased most for any artform was Supported Communities, for Christmas shows (down a huge 43%: showing the cost of living really biting for the least well off)
- The segment that decreased most, most consistently was Home & Heritage (we’ve seen reductions for this segment a lot over recent years, so >20% decreases across all four artform isn’t a surprise)
- For both of the artforms with biggest decreases, Christmas shows are the artform which decreased most (there seems to be a turn against this festive tradition, which seems to be losing out as families prioritise their spending)
- Christmas shows are the only one of the artforms with a drop for Up Our Streets, but it’s big: -28% (even segments that are going more to other artforms are dropping for Christmas shows)
- Few segments are growing a lot for Christmas shows, either (they have the lowest ‘highest growth’ of any of the artforms: 15% for Experience Seekers, with others being 35%, 80% and 41%)
- The segments that decreased for Christmas shows tend to be older (there were big decreases for Supported Communities, Home & Heritage Dormitory Dependables; younger segments rose, if not by a lot)
- Christmas shows was the only one of the artforms to show such a clear age difference (although the broad trend could be seen elsewhere, there’s something distinctively concentrated about the impact of age on Christmas show booking)
- The biggest growth segment is different for each of the four artforms (Children/family — Trips & Treats, Christmas shows — Experience Seekers, Musical theatre — Metroculturals, Plays/drama — Frontline Families
- The overall picture is difference for each artform (artforms matter when understanding audience behaviour: it’s not just about overall shifts by population group, regardless of what they are going to see)
- The breadth of increases by artform is linked to the overall amount of them (Musical theatre has grown most, and for all but two segments; Children/family second most, by all but three; then Plays/drama, by all but four; then Christmas shows, by all but five [i.e. half of segments])
- The single biggest proportionate growth is Metroculturals to Musical Theatre, up 80% (this most-highly-engaged group ‘taking up’ musical theatre in such numbers may suggest a break-through in cultural cache for this artform; this also gave this group the highest range of variation by artform, of 92%)
- Musical theatre dominates the growth by segment (the first, second, third and fifth highest increases are all for this artform; all eight of the segments that increased for musical theatre did so more than for any other of the artforms)
- Musical theatre was the only one of the segments which saw growth in sales to Commuterland Culturebuffs (although only by 2%)
- Commuterland Culturebuffs show less variation by artform than any other segment (a range of 10%, from -8% for Children/family work to +2% for Musical theatre; the next lowest range was 14% for Home & Heritage).
- Two segments stand out for growth by artform: Trips & Treats and Frontline Families (both grew for all four artforms, by similar proportions, and by at least a third for three out of four; Christmas shows being the exception)
- Trips & Treats and Frontline Families particularly stand out for growth in Plays/drama (there is a 19% point gap to the third highest growing segment, Dormitory Dependables)
- Four segments grew across all four artforms (Trips & Treats and Frontline Families, of course, but also Experience Seekers and Kaleidoscope Creativity: suggesting a shift towards younger and more urban segments, including those with young families in)
- Three out of four artforms saw growth for three out of four ‘lower-engaged’ segments (despite the cost of living, the picture isn’t that lower-engaged, and typically less well-off, segments are reducing the number of tickets bought across the board)
- Groups of higher/medium/lower engaged segments don’t move together (the only artform which saw growth, or reduction, across all segments within one of the engagement bands was musical theatre, for higher-engaged segments: in all other instances, at least one segment bucked the trend).
These stories come from one chart, showing one measure (change in number of tickets) across one time period (2019/20 compared to 2024/25) reported one way (as a percentage, rather than absolute values). This gives a hint at the richness available in the full Audience Answers dataset, which we will continue to explore and to share.
(PS: Are there other stories from this chart that we’ve missed? Let us know…)
