We collated the number of performances coded as Christmas Shows by date, for a consistent cohort of 224 venues, across the six years from 2019/20 to 2024/25.
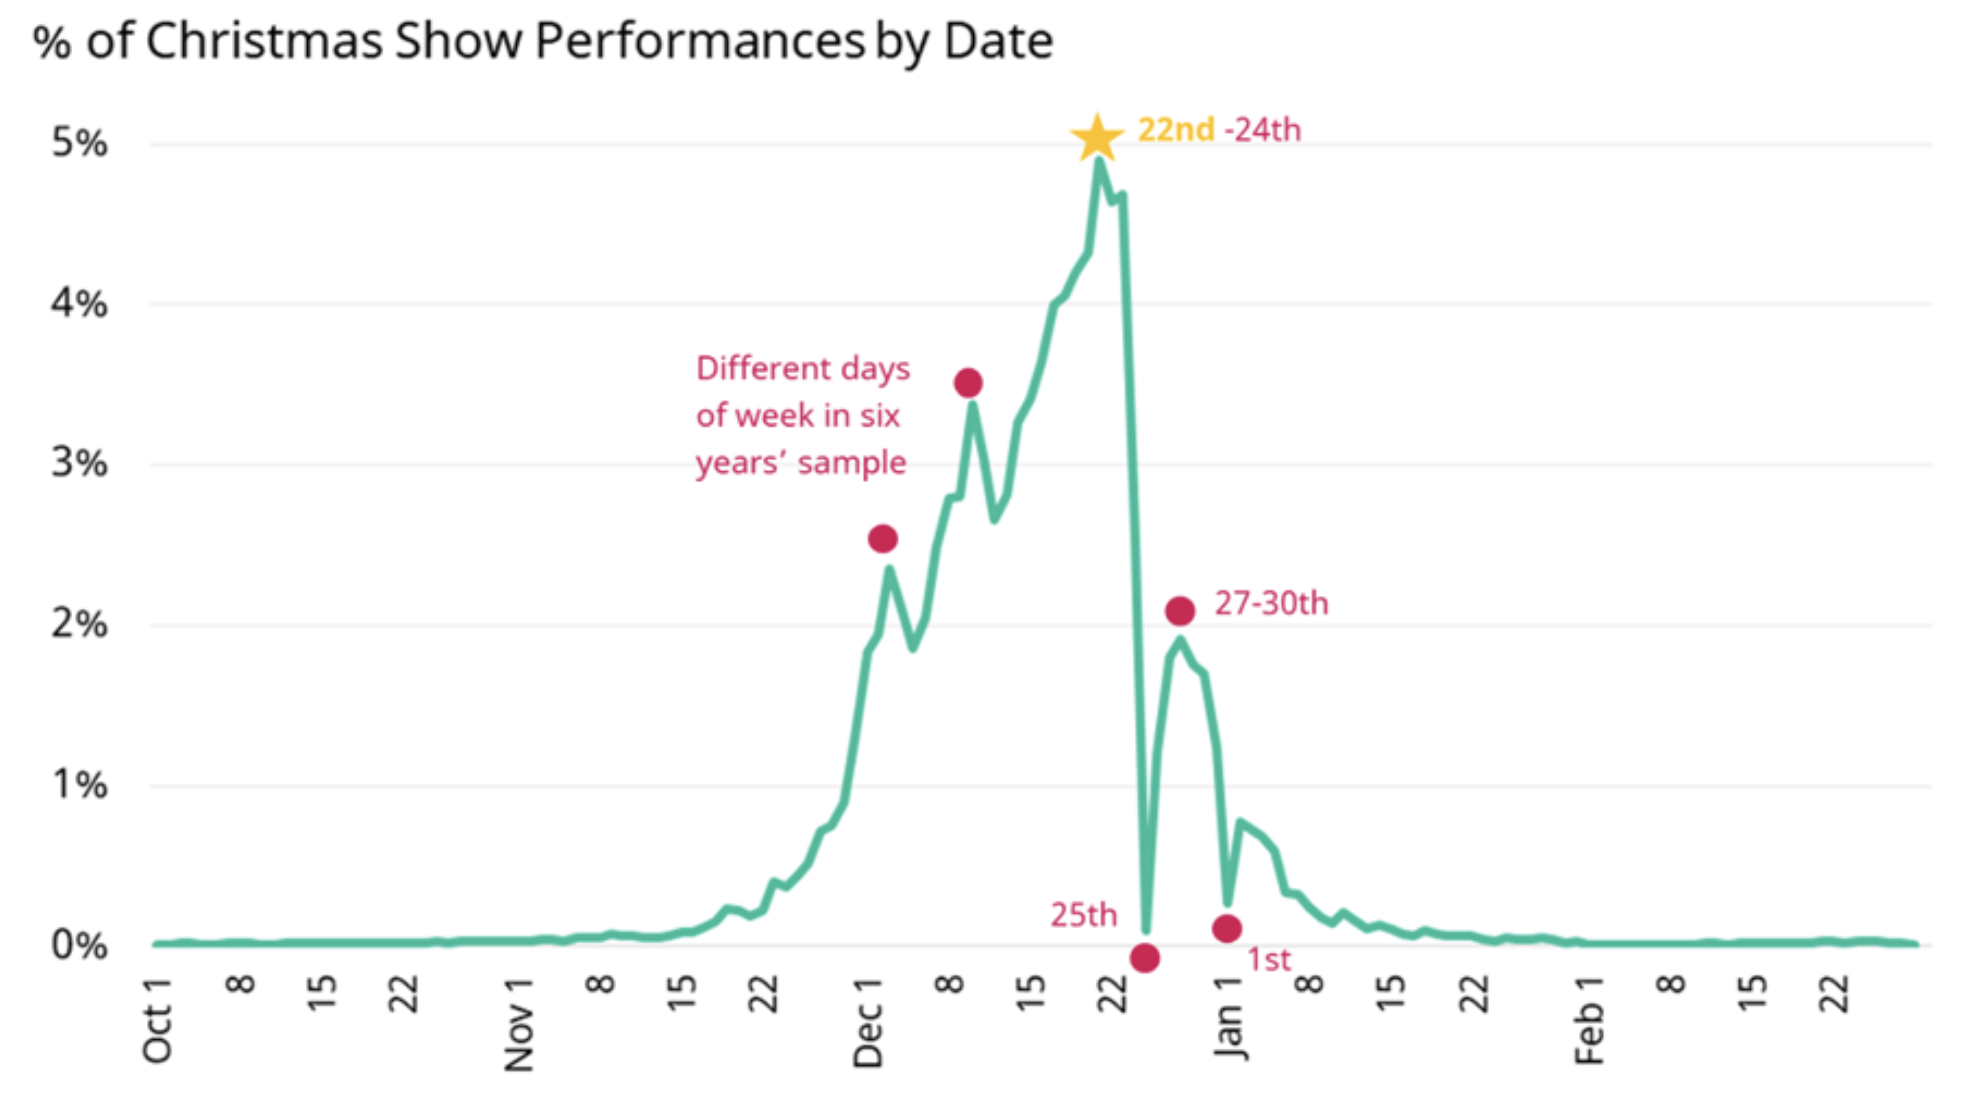
Christmas Shows are (unsurprisingly) concentrated in December, but perhaps to a greater extent than may be expected: 85% of performances in December, with only 2% before Nov 16th and 2% after Jan 10th:

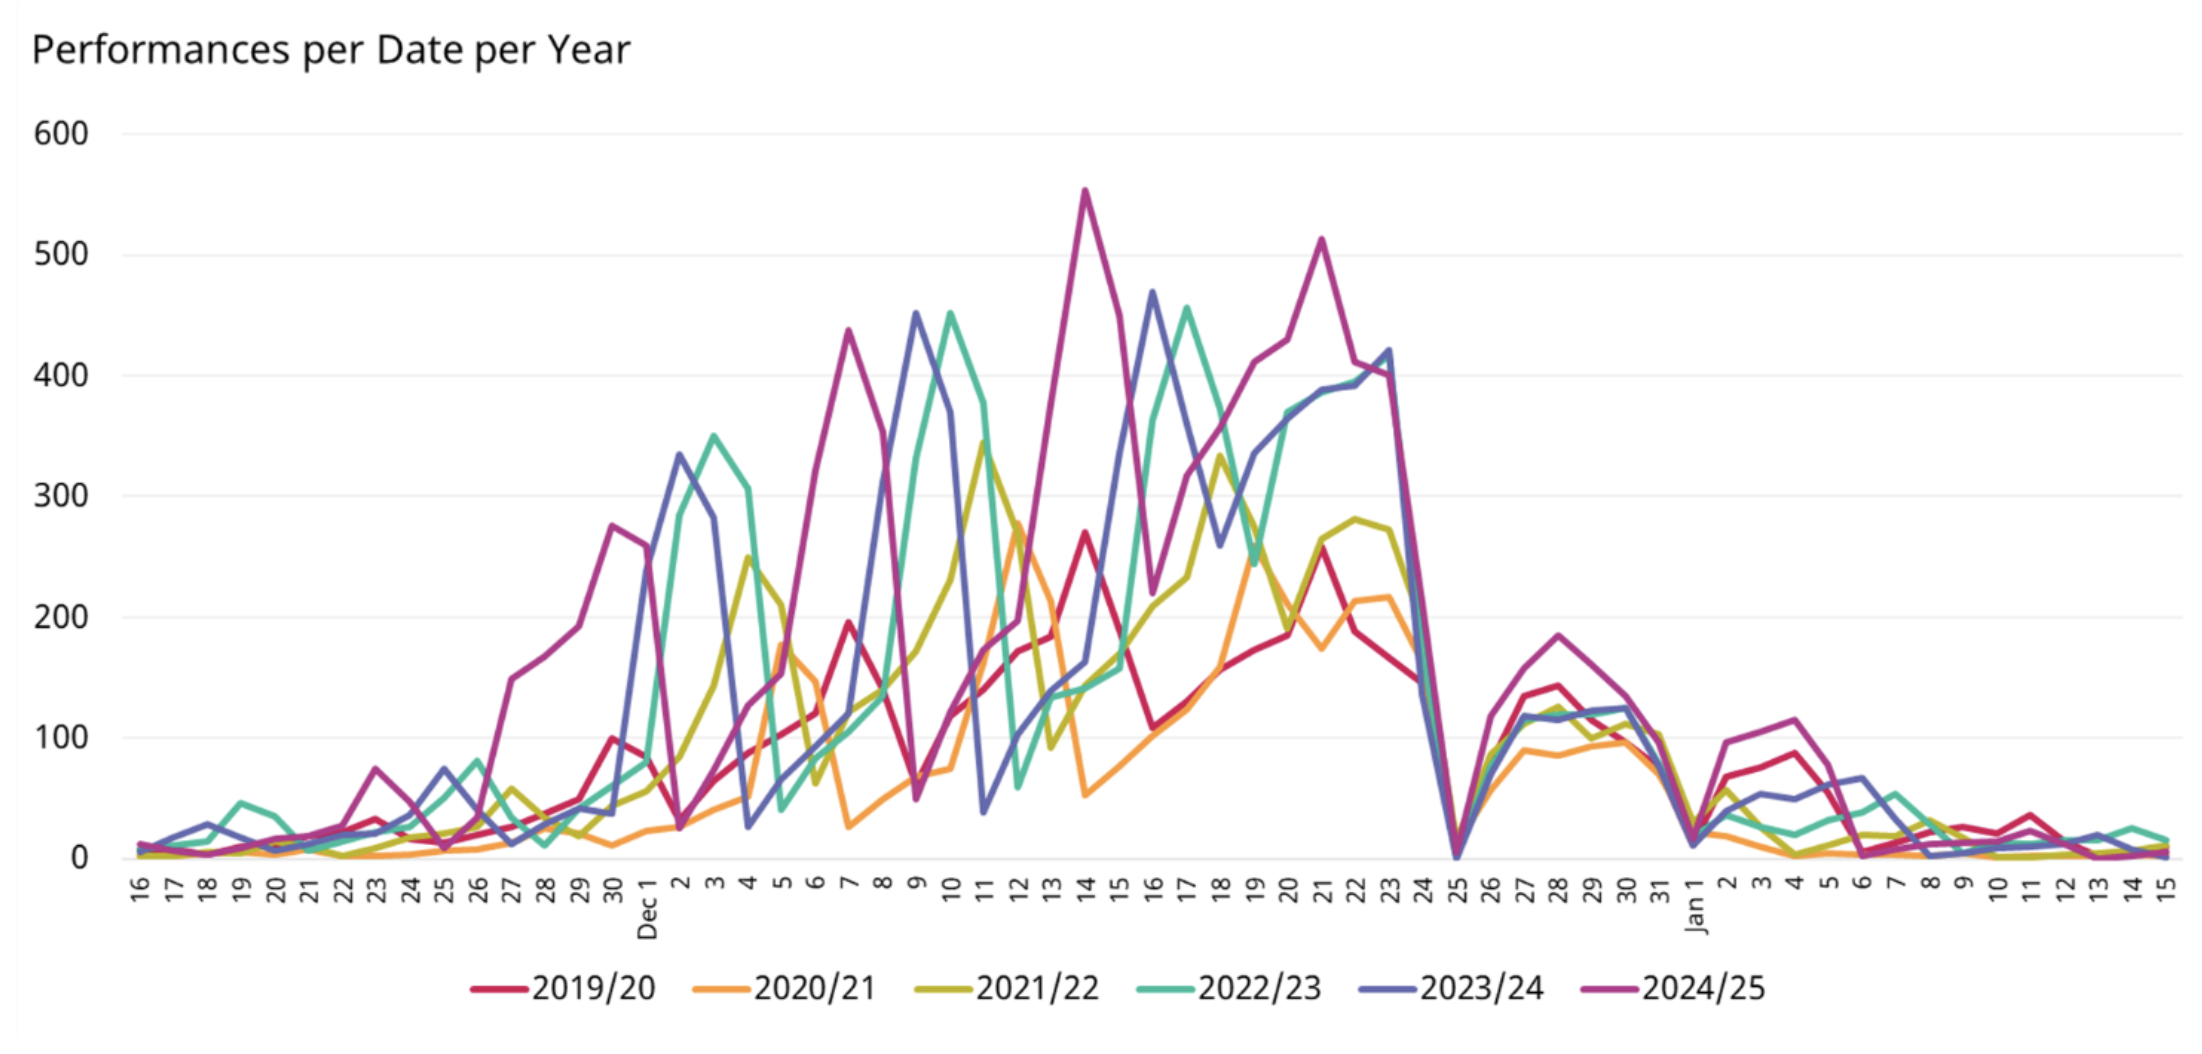
The date with the highest number of events each year was:
- 19/20: Sat 21st
- 20/21: Sat 19th
- 21/22: Sat 18th
- 22/23: Sat 17th
- 23/24: Sat 16th
- 24/25: Sat 21st
i.e. the last Saturday before the 23rd appears to be have the most events (but the last couple of days before Christmas always have high numbers, regardless of the day of the week, resulting in high aggregate figures).
Of more note is the extent to which the distribution of events has changed, year on year.

Overall, there is a jumbled picture before Christmas (since the day of the week of specific dates varies by year: there are, for example, more events on Saturdays than Tuesdays). However it is notable when the figures from different years drop into lock-step. This provides a visual indicator of the experience of time at Christmas, when for a brief window, the date becomes more important than the day of the week (indeed, it can be easy to forget what day of the week it even is!).
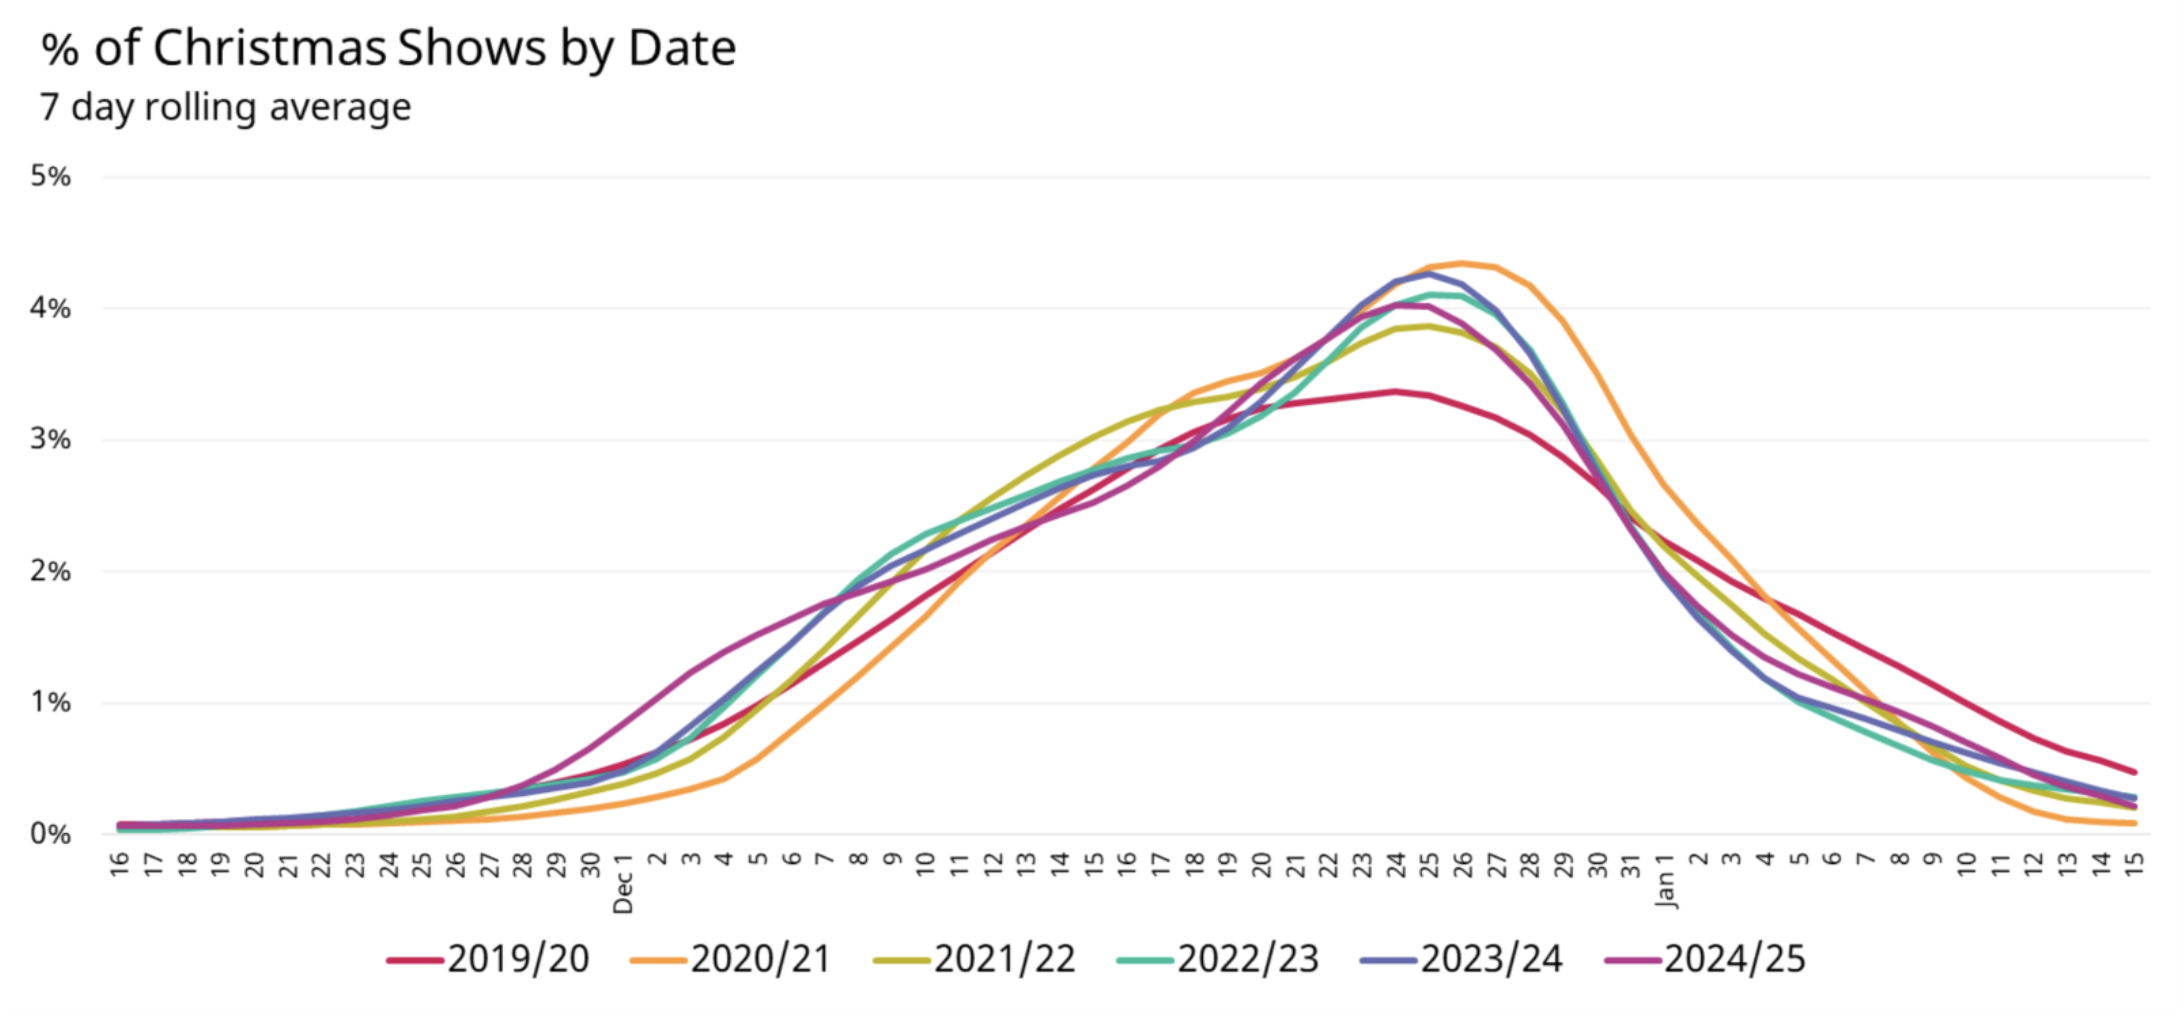
To make it easier to see what it going on year by year, we can represent it as a seven-day rolling average percentage of all Christmas events each year. This then reveals where the distribution of events has changed, rather than just the overall volume (which has increased, by 84%):

This reveals the following progression (noting that these are overall figures, based on a consistent cohort of 224 venues, rather than results for individual venues):
2019/20: A relatively ‘flat’ distribution of events, but with a notably higher proportion from Jan 6th (Twelfth Night) than in later years
2020/21: Many fewer events overall in this Covid-affected year, but since those around Christmas itself were most likely to still be ok, a much tighter ‘peak’ around Christmas itself (and lower proportions than other years outside the three weeks from 12th December to the 10th of January).
2021/22: Still a ‘narrower’ distribution of events than in most years, focused on Christmas itself, but with lower proportions than 2020/21 between the 18th December and 8th January. Substantially higher proportions of events on the earlier side, from very late November until mid December.
2022/23: Further small drops in the new year, but higher proportions in late November through to around the 10th of December (but also a tighter Christmas peak), showing the Christmas period moving a little earlier, probably to maximise revenue.
2023/24: Very similar to the previous year, with minor adjustments: a slightly flatter distribution, pushing slightly earlier and later, but also building to a higher concentration around Christmas itself: this suggests a sense of having over-corrected in the New Year, but trying to push Christmas a little earlier if possible.
2024/25: A further reduction of the ‘over-correction’ in the New Year and less concentration at Christmas itself, but more events pushing back into late November, but with steeper ‘shoulders’ in both November and January, suggesting a more defined (and capitalised-on) Christmas period.
Overall, this suggests a shift to an earlier Christmas period, with a clearer delimitation, but more even spread within that overall season. We will continue to keep an eye on this trend for 2025/26, so see whether the last year heralds a longer-term adjustment, or another one-off attempt at optimisation, which will continue to shift.
