Support for organisations
March 2023
This research is from The Audience Agency's nationwide longitudinal (ongoing) panel survey of changing views about participating in creative and cultural activities through the recent and ongoing crises, and beyond, the Cultural Participation Monitor.
Contents
Themes
Half of those who previously did so intend to donate less over the next couple of years, but most who have cancelled memberships do intend to restart them, and c.80% of lapsed volunteers expect to return to their activities.

Memberships
Although 40% of people who held cultural memberships pre-pandemic have since cancelled them (especially true of younger and lower engaged groups) , a majority of those (c.60%) intend to restart them in the next couple of years.
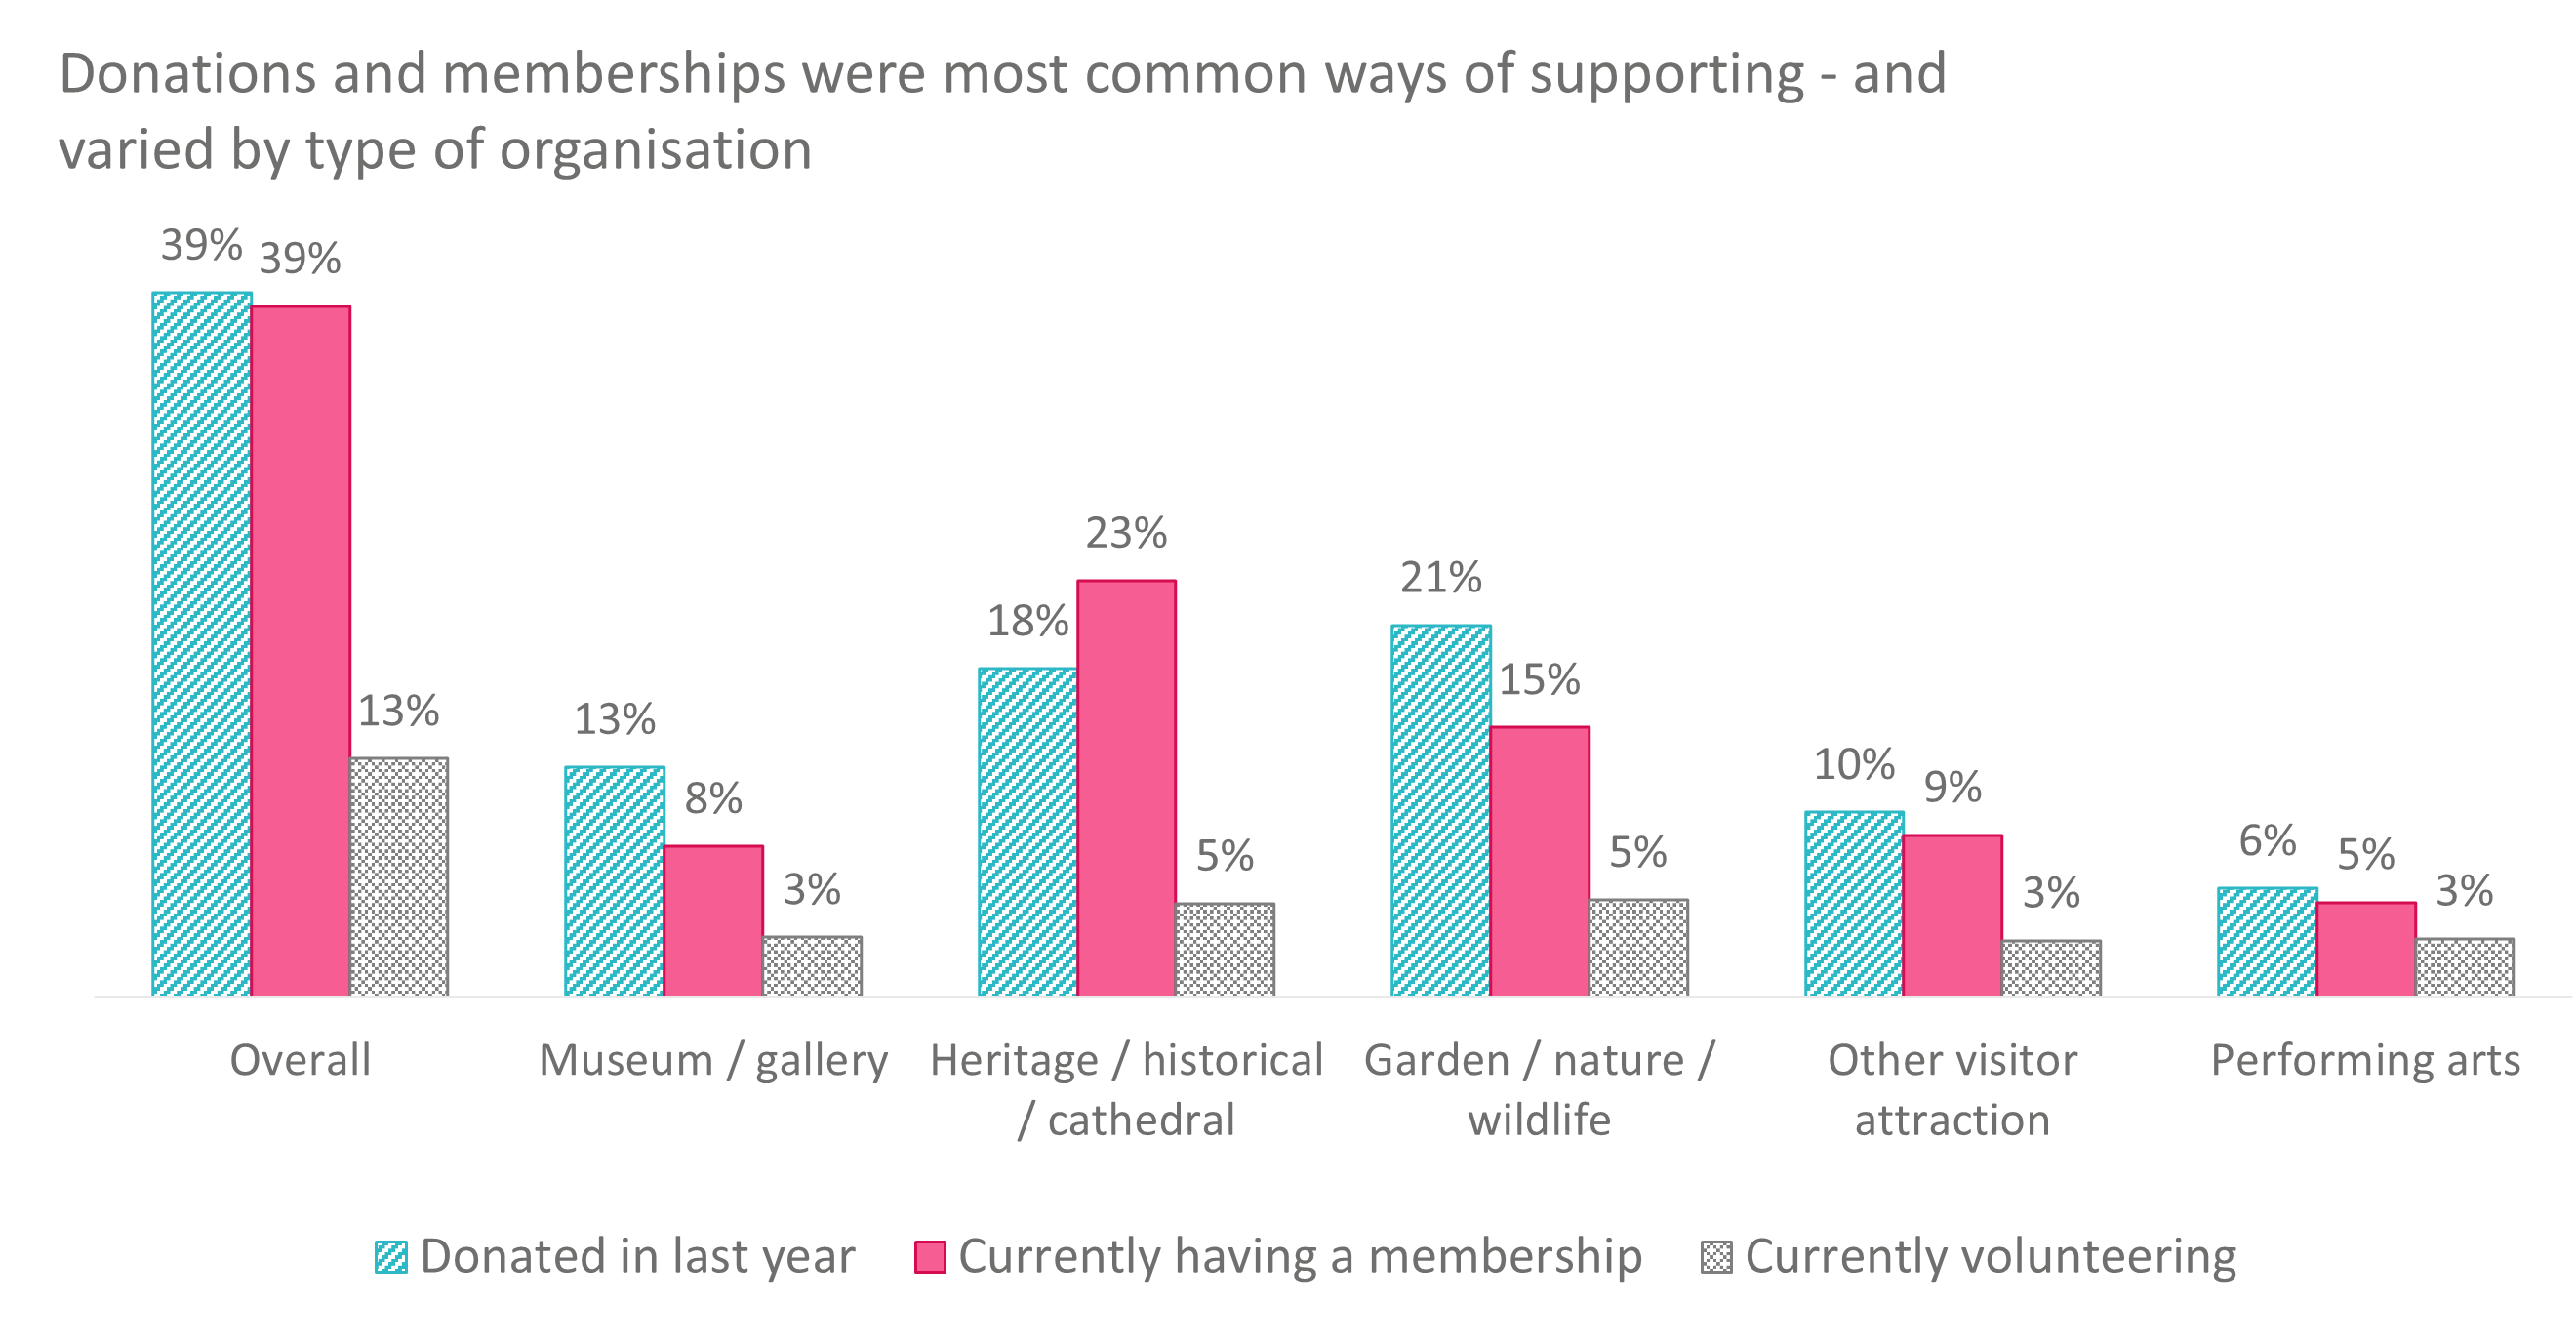
45% of people said they had memberships with cultural, heritage and nature organisations pre-pandemic; of these:
- around 1 in 7 (13%) had cancelled all of their memberships since Covid,
- 1 in 4 (27%) had cancelled some but not all,
- and 6 in 10 (60%) hadn’t cancelled any(this was even higher, at 70%, for heritage memberships, a category including National Trust and English Heritage).

- At 43% and 39% respectively, reasons for having cancelled memberships over the past 12 months were pretty evenly spread between Covid and cost-of-living.
- The proportion who had stopped a membership was higher for younger and typically lower-engaged groups.
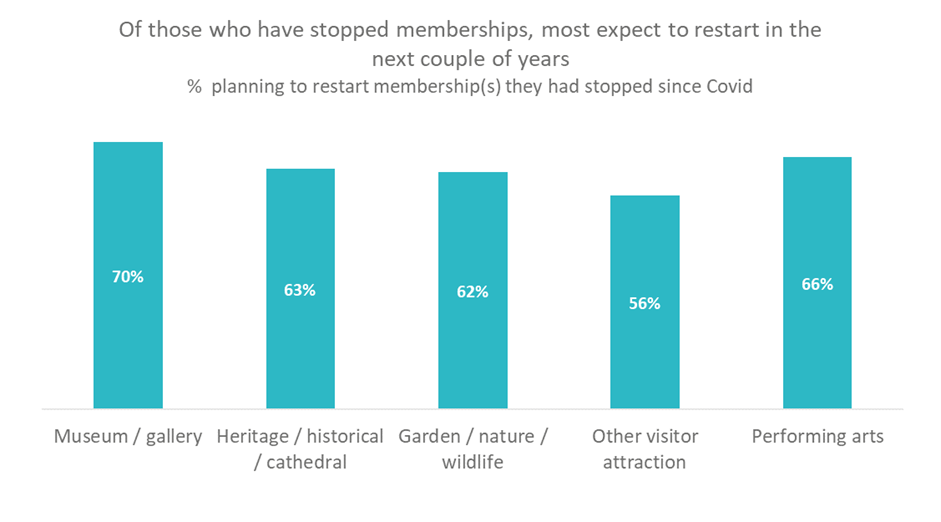
Most of those who have stopped memberships expect to restart in the next couple of years:
- 63% probably/definitely restart of those who've stopped heritage memberships;
- 62% of those who'd stopped nature memberships;
- 56% memberships to other visitor attractions.

Volunteering
While volunteering at cultural sites has declined slightly since the height of the pandemic (15% of the population), c.80% of those who have fallen off expect to return, particularly older people and those with young children.
- 4 in 7(40%) have not stopped volunteering at all since Covid-19.
- Nearly 1/2 (47%) had stopped volunteering, but have now started again.
- and only about 1 in 10 (14%) have stopped and don't plan to restart.
- At 39% and 28% respectively, reasons for having stopped volunteering over the past 12 months were comparable between Covid-19 and cost-of-living.

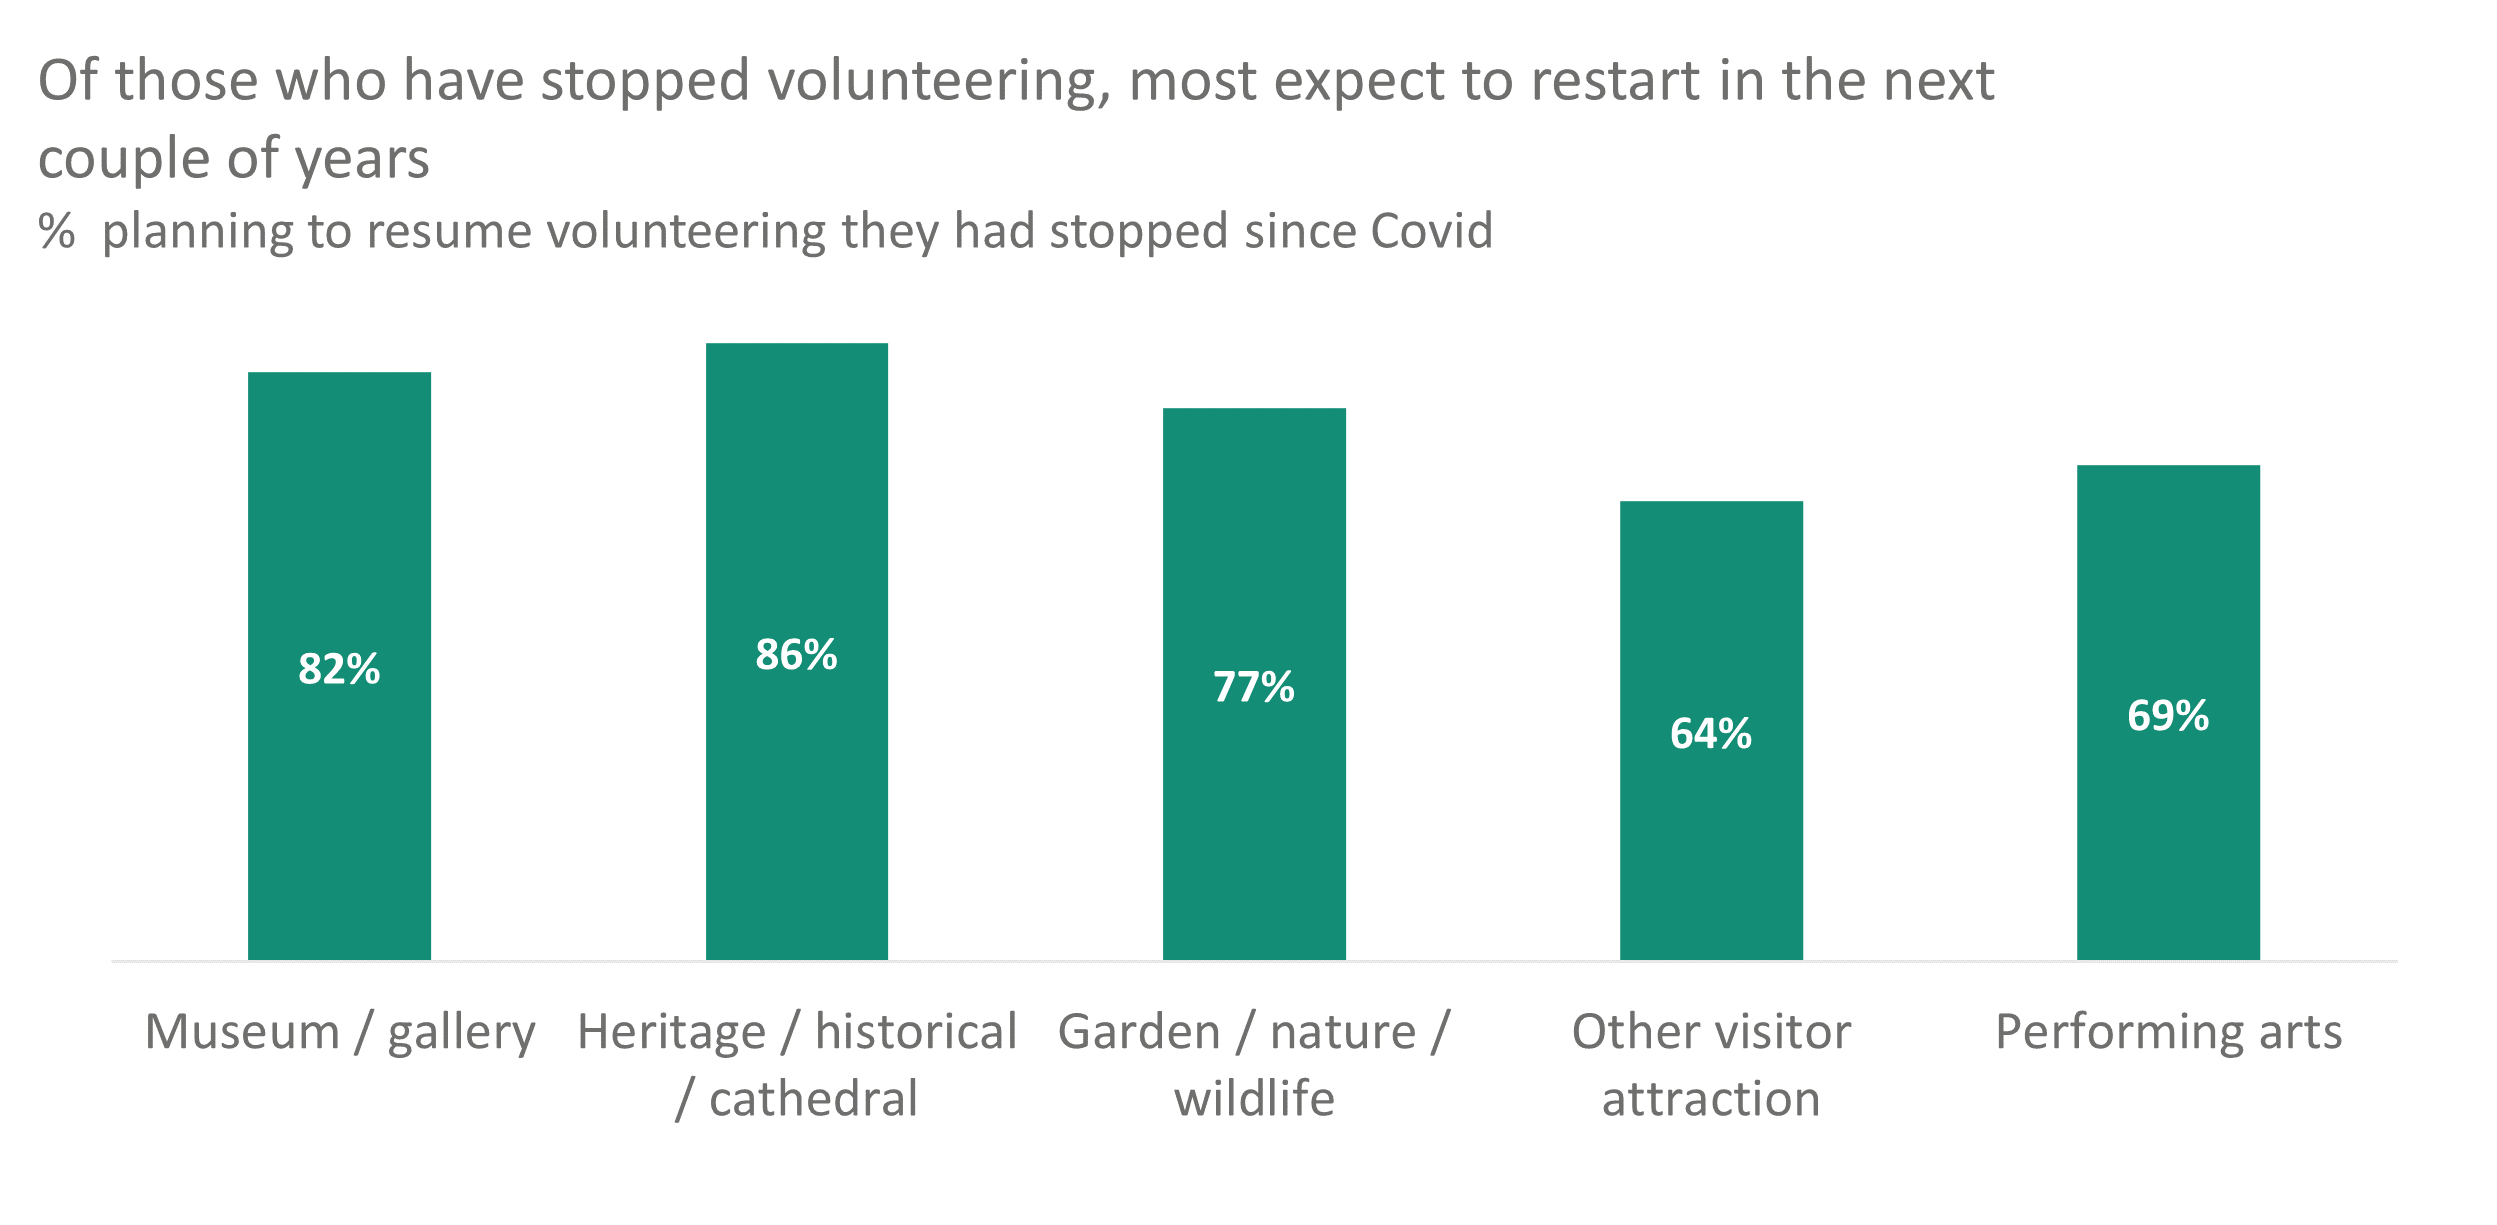
- Crucially, the vast majority (80%) of those who volunteered previously but haven't yet taken it up again do still expect to return (86% probably/definitely for heritage, 77% for nature etc).

- There is some indication (despite small samples) that older people, along with those with children, are those most likely to continue volunteering.
Donations
Half of people expect to donate less to cultural organisations over the coming year - especially younger, family, and lower income respondents - even amongst groups who expect their financial situation to improve.
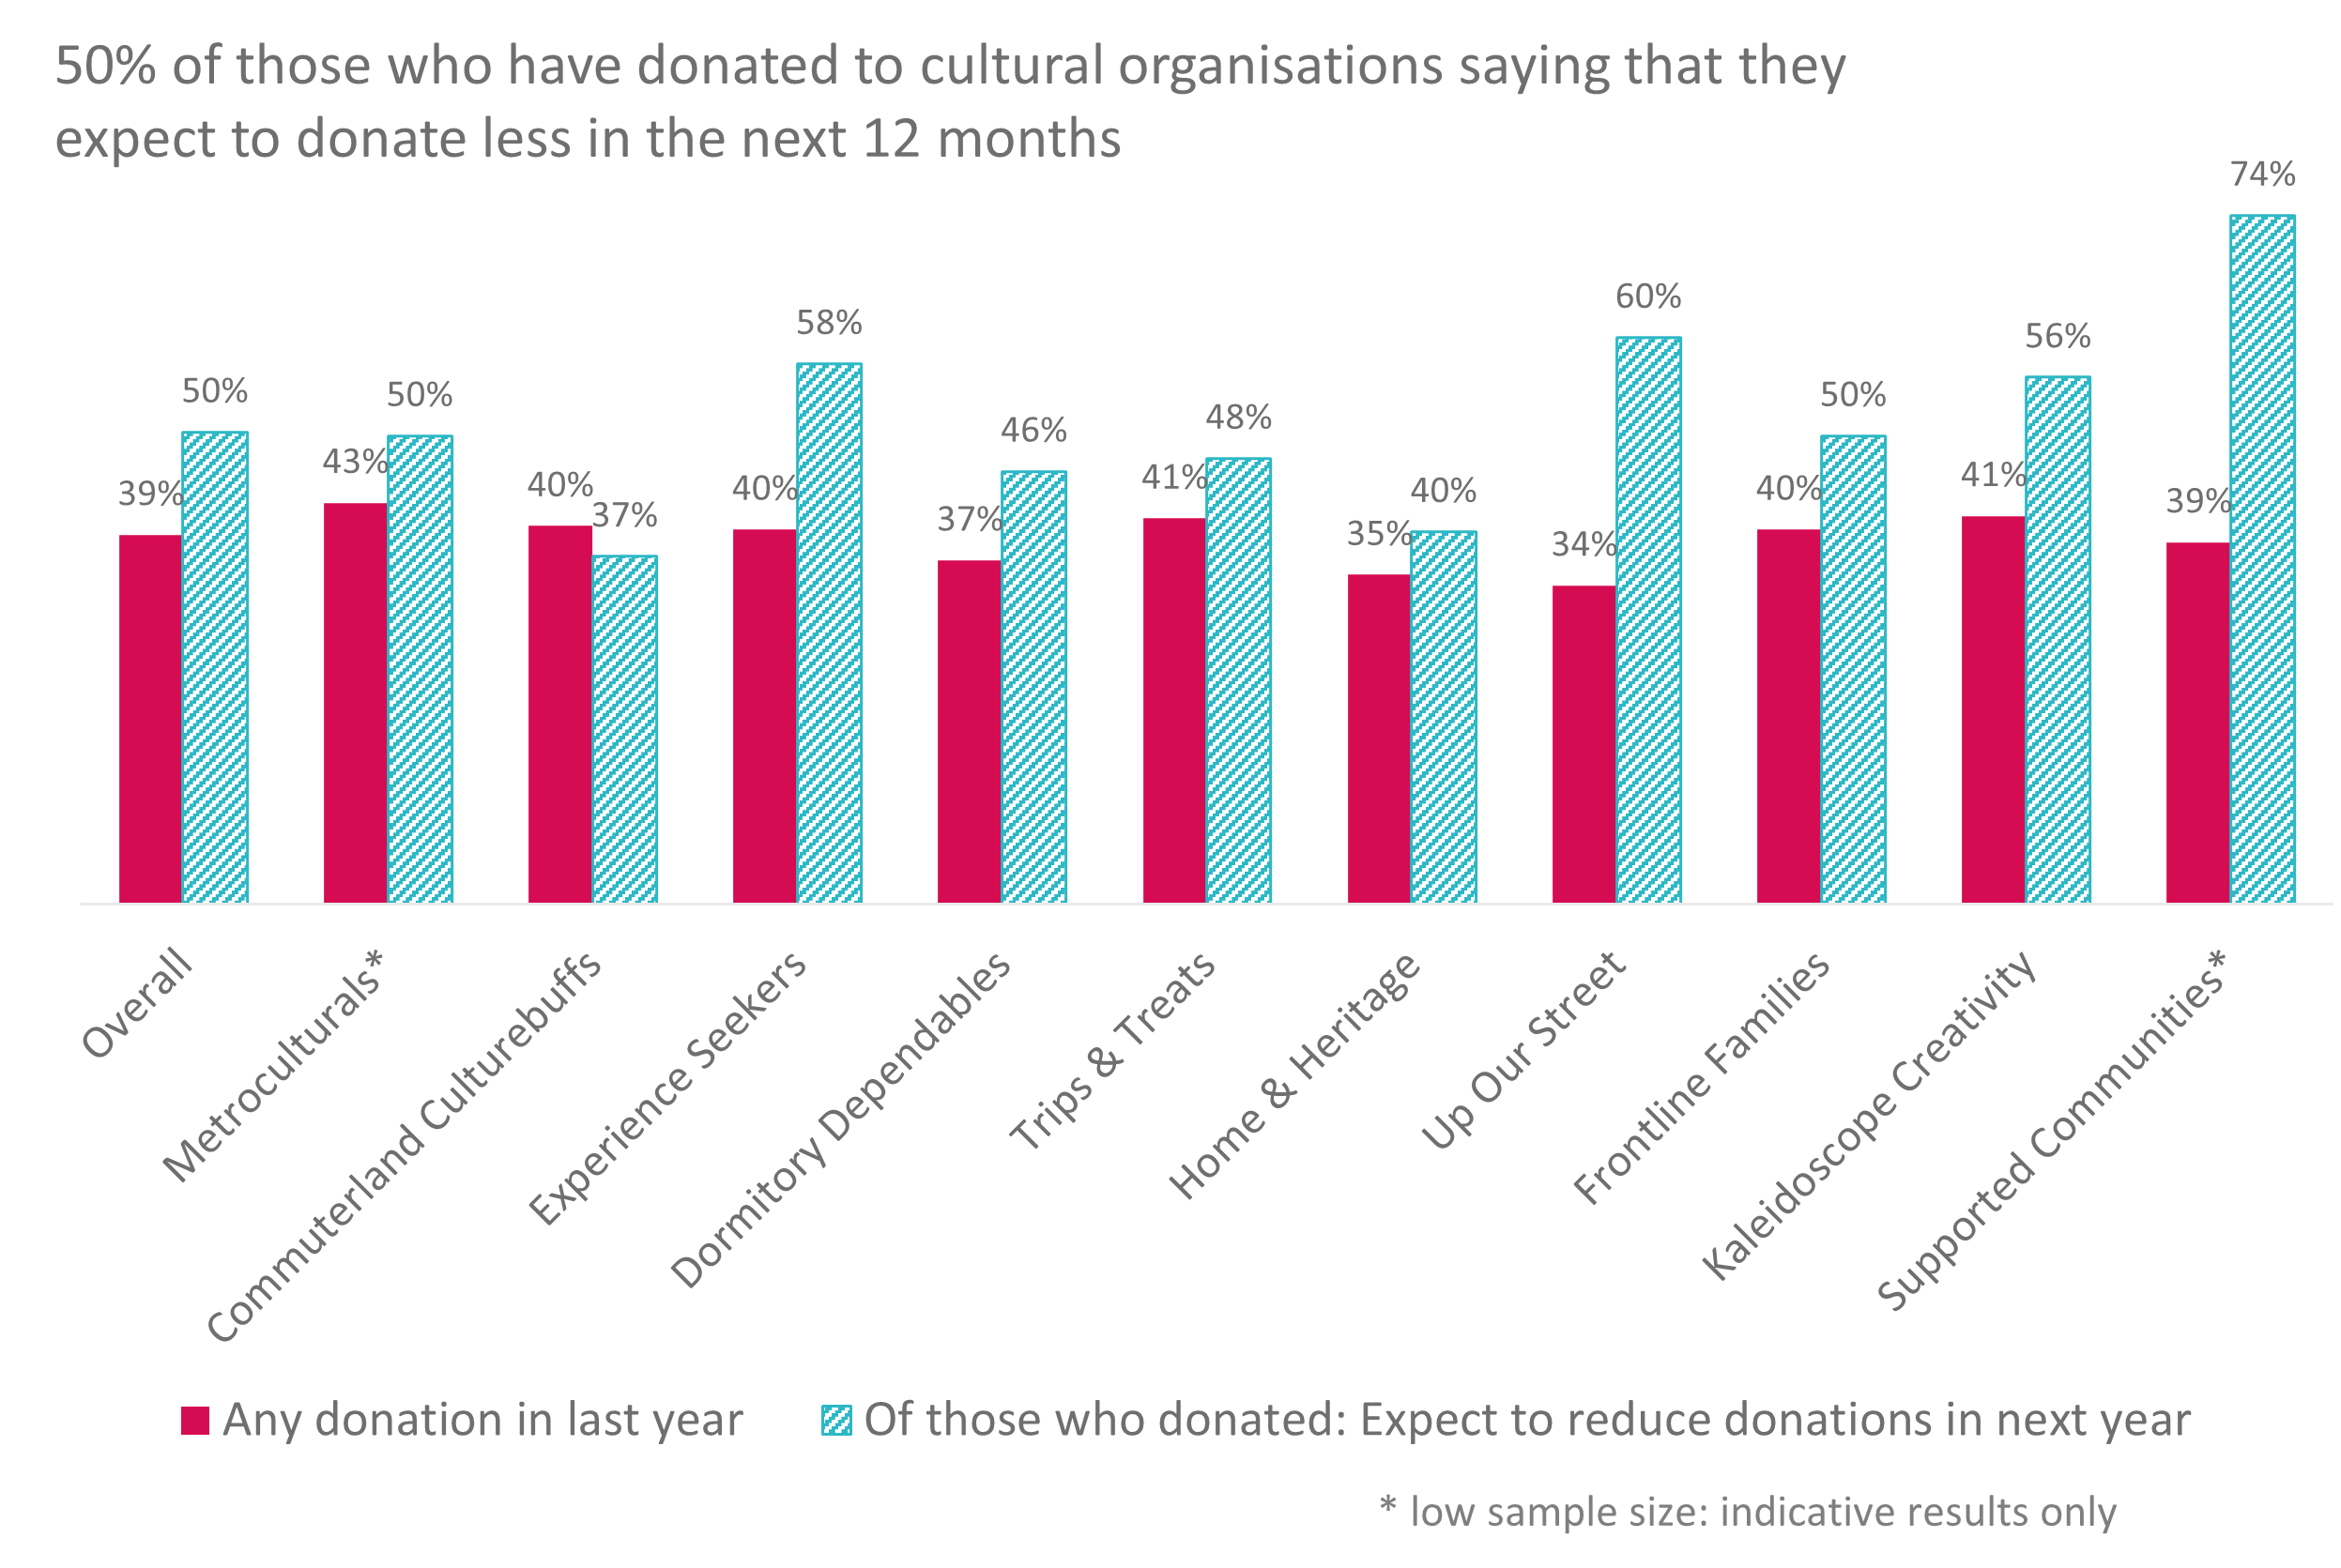
- People are expecting to donate less: with 50% of those who have donated to cultural organisations saying that they expect to donate less in the next 12 months (and only 17% not expecting to reduce donations). The lower engaged AS segments Up Our Street and Supported Communities are the highest for reducing donations.

- This is particularly the case for younger (U45s) and lower income groups, and those with children (even families who feel that they have got better off in the last 12 months).
- There’s a potential challenge for organisations if there is greater differentiation between the profile of donors and attenders, due to a greater dependence for donations on groups which have been engaging less, both in person and online, since the pandemic.
Related videos
Cultural Participation Monitor | Latest Findings on Audience Attitude and Behaviours
Watch nowTEA Break: Bad behaviour? - What types of behaviour people prefer when attending culture
Watch nowTEA Break | From Interest into Action
Watch nowTEA Break | More Insights on Changing Audiences
Watch nowTEA Break | Key Changing Audiences for Art Forms
Watch nowCultural Participation Monitor | Latest Findings on Audience Attitude and Behaviours
Watch nowOther findings from Wave 8 | Mar 2023 | Cost of Living, social media, support for organisations
-
Cost of living outweighs covid
Over 60% say that the cost-of-living is already slashing their ability to attend culture events (more than twice than because of Covid concerns), with even higher numbers expecting this to still be the case in 6-24 months' time.
-
Engagement trends
1/3 still report attending arts and culture less than pre-pandemic, though under 35-year-olds are returning more than others, and are more likely to identify as the 'initiators' of social cultural activity with friends and family.
-
Late booking trends
Panto season pre-sales stand out as being back on track, though this goes against an overall trend towards later booking, with over 40% saying that they now tend to book more last minute than they used to.
