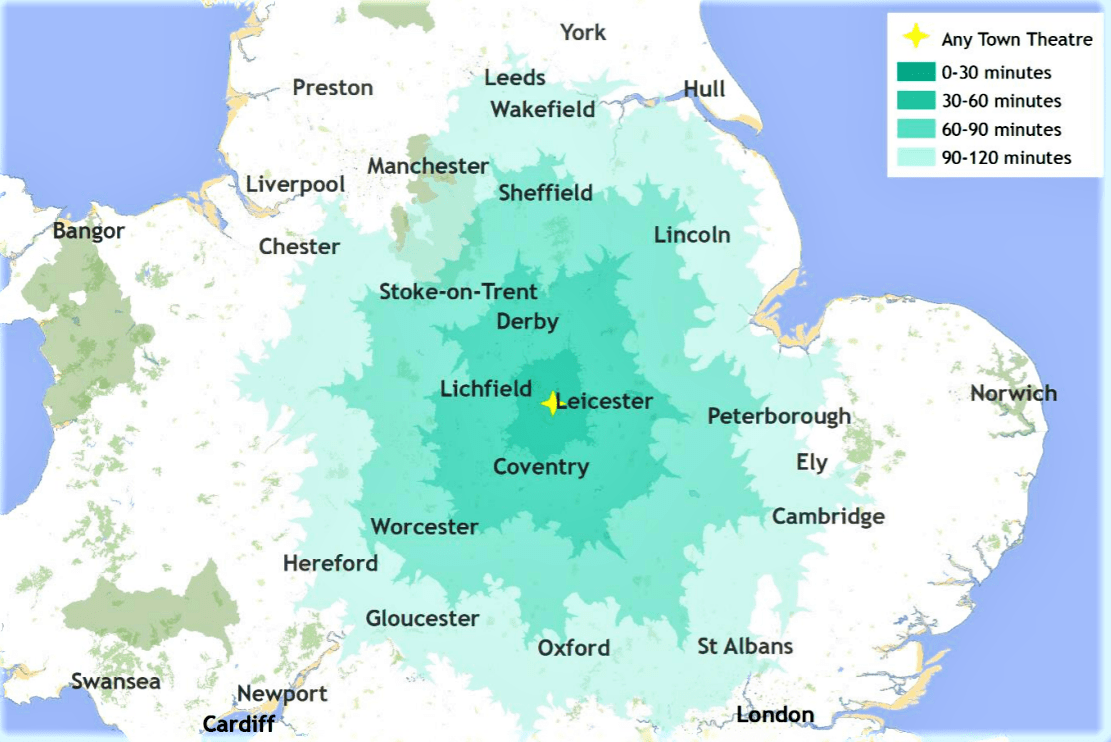
Drive Time vs Distance
Contents
For most venues and events, the majority of audiences continue to tend to be quite locally based.
As a general rule the immediate catchment area should continue to be principle focus of attention for the core of marketing and audience development work.
Drive-Time Explained
How does an understanding of drive-time help us?
Distance from a venue persists as a strong barrier to attendance, and strategies aiming to draw audiences from farther afield need to consider this as an element to be addressed within the marketing mix. However, it is also important to remember that the average result doesn't always reflect the case for every organisation and every circumstance.
Understanding Drive-Time / Distance
While the nature of an organisation’s event programme will impact on its geographical reach, the nature of its location will also have an effect.
So, for example, 15-minutes’ drive-time from a venue in a rural area might mean ten or twelve miles travelled, whereas in one of the big urban centres the same drive-time is likely to relate to a much smaller catchment area. So, another way to look at the geographical reach is to analyse distance travelled.
Urban vs Rural
The effect of urban centres on audiences' willingness to travel large distances is quite stark in comparison. Looking at the most recently available data from our London cluster, we can see that fewer than 30% of bookers to events at these London based organisations live within 5 miles distance of the events they attended. That’s less than half the proportion of the NPAC audience that came from within the same, most immediate area. The most urban centres significantly attract a more geographically dispersed audience.
These findings seem to run counter to what you might have expected to see, that perhaps people living in the most urban settings with a wealth of available provision and easy access don’t have to travel as far as people in more provincial or rural settings. This however might be explained by a number of factors, such as quality and speed of urban public transport services, the high profile of much of the available artistic content in the most urban settings, and other factors such as the effect of commuting on audiences.
Further Questions
So, these observed differences between the outcomes within urban and provincial locations illustrate that, whilst the Audience Finder “Big Data” pool is already able to start answering some big questions, we can see that these answers will inevitably lead us to ask more detailed and nuanced questions, that our ever-growing pool of audience information will make us much better equipped to understand.
Why is this useful?
Knowing where your audience comes from is one of the essential elements of mapping and can form part of your audience development planning. If you understand where your audience comes from you might then be able to use geography as a means to usefully segment your database.
Once you have identified your audience segments by who they are, what they do and/or what they think, information on where they come from (based on drive time/distance), combined with your primary research and data analysis, provides geographic areas for you to more effectively target those audiences.
Future Insights
We are now developing bigger, more wide-ranging, reliable and robust standardised datasets to be able to analyse the extent to which artform is a significant factor in the distances audiences travel to attend the arts.
We will be able to show if and how the case varies for each of the English regions. For example, we’ll be able to show whether audiences in Yorkshire travel farther to attend, say “Classical Music” events than audiences do in the South West. And these results can then be assessed in the light of the relative available provision and access to events.
As the data set grows we will be able to answer questions such as:
Do the most frequent attenders live the closest, or are there a significant proportion of audiences who attend frequently from farther afield? How do the size and nature of catchment areas for different venues vary according to a number of factors such as, venue size, programme, artform?
Sharing these insights with the wider arts sector can give organisations valuable resources and knowledge contributing towards their own audience development.
Drive Time and Distance Report
Discover where your customers live in relation to your venue and how far they travel to get to you.
Knowing the extent of your reach is essential to understanding the market you’re operating within. The Drive Time and Distance report lets you see how ‘local’ your core audience is, and to what extent your audiences are drawn from far and wide.
Visualising your audience's geographic spread - e.g. “36% of our visitors come from within a 15 minute drive time of our venue” - can help you to think about your catchment area in terms of people, rather than postcodes, and take an informed approach to marketing, promotion and even programming.
Click the map to explore an example version of this report:

