
Introducing the Overview Dashboard

See your key ticketing metrics at a glance.
- Benchmark your data against organisations of a similar size.
- Readily available year on year or custom comparison.
- Actionable metrics fully explained.
- Free for existing Audience Answers users on the Snapshot plan, with enhanced, paid plans coming soon.
- Developed based on your feedback, with new functionality being introduced during the year.
- See your dashboard filtered by custom event groups Essentials
Don’t yet have an account or ticketing data?
Find out more about our ticketing plansAlready registered?
Sign in to Audience AnswersProfile
Knowing who attends (and who doesn't) helps you to target your marketing, programming and development.
- See the top Audience Spectrum segments you attract.
- Compare your audience against your local population to find out who to target.
- Find out your top local non-attenders to see which groups have the highest potential to target near you.

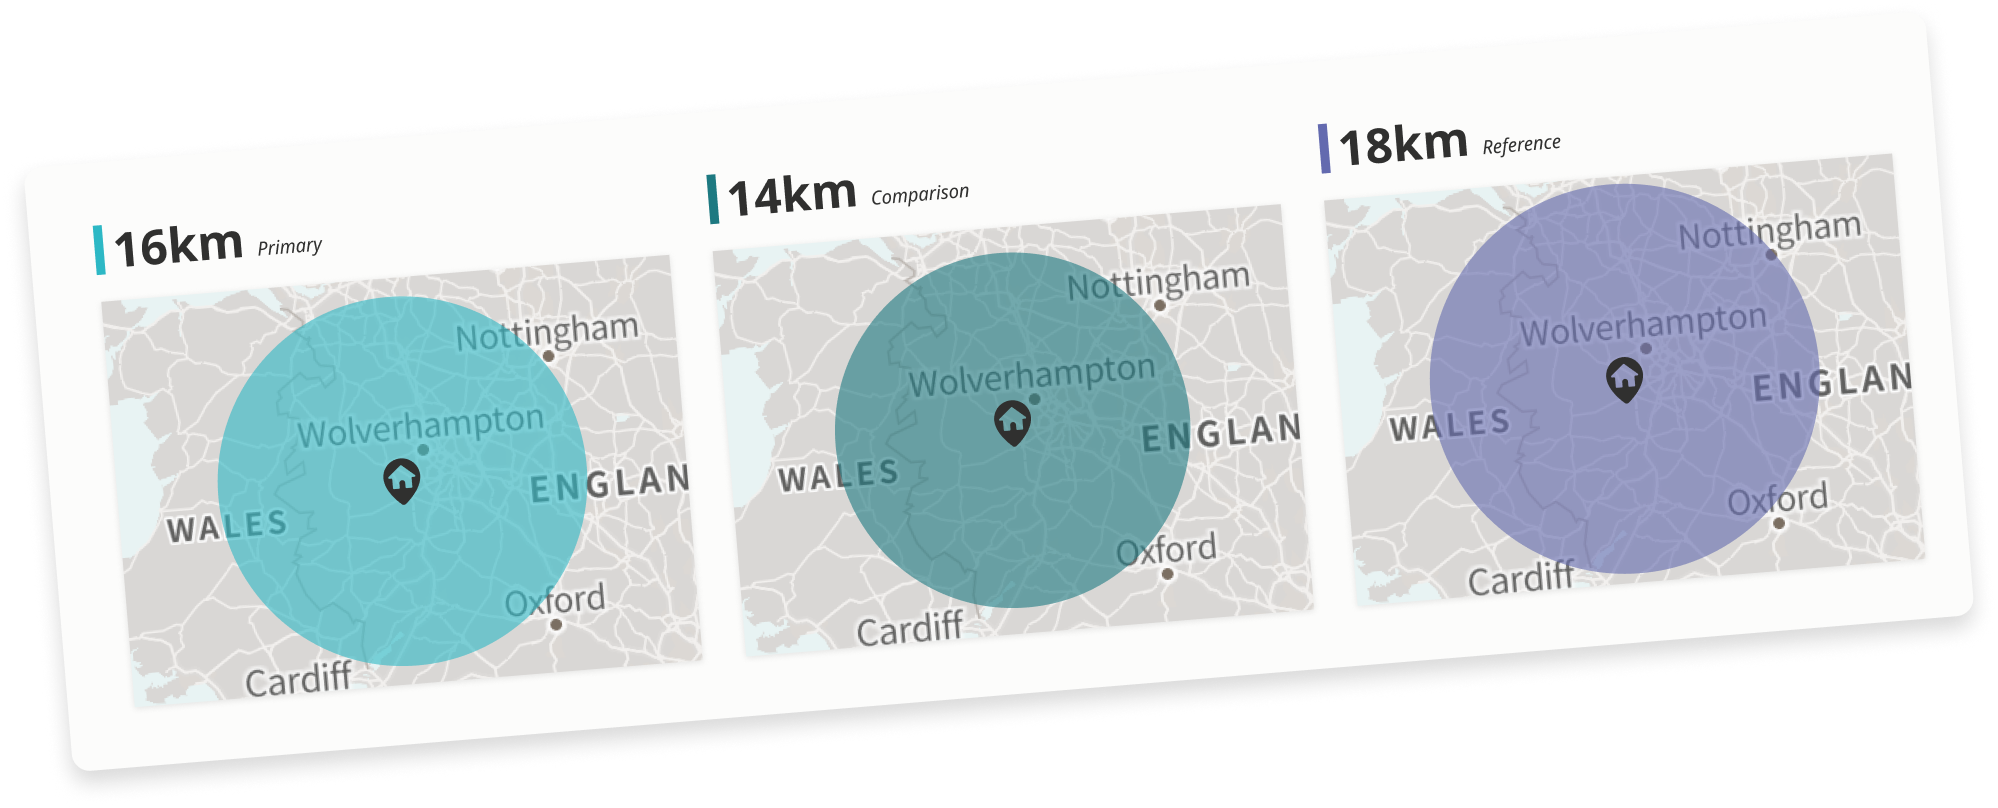
Place
Monitor how your catchment area is changing.
- Compare your primary, comparison and pre-COVID catchment areas.
Sales
Get a snapshot of your organisation's topline sales figures. Understand trends and context by comparing year on year or against benchmarks.
- Benchmark of similarly sized organisations.
- Year on year comparison.

Don’t yet have an account or ticketing data?
Find out more about our ticketing plansAlready registered?
Sign in to Audience Answers